

Question
Primary Objective: For this project, you will select a basket of seven (7) assets, calculate their individual risk/return value, combine these into the efficient frontier,
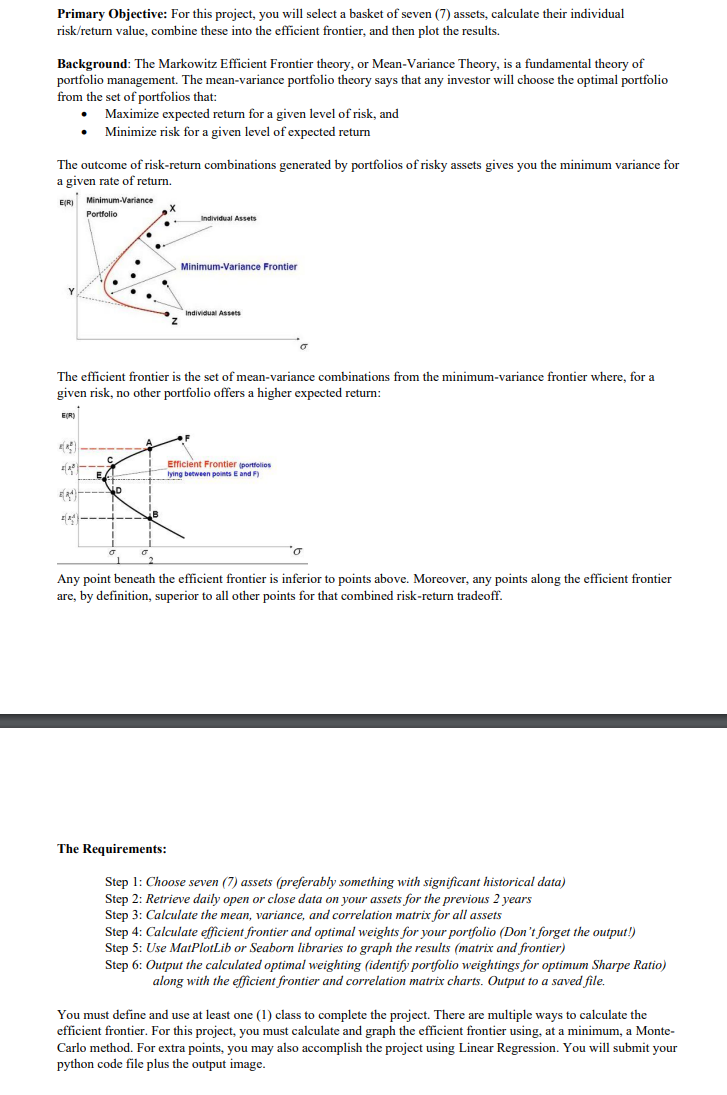
Primary Objective: For this project, you will select a basket of seven (7) assets, calculate their individual\ risk/return value, combine these into the efficient frontier, and then plot the results.\ Background: The Markowitz Efficient Frontier theory, or Mean-Variance Theory, is a fundamental theory of\ portfolio management. The mean-variance portfolio theory says that any investor will choose the optimal portfolio\ from the set of portfolios that:\ Maximize expected return for a given level of risk, and\ Minimize risk for a given level of expected return\ The outcome of risk-return combinations generated by portfolios of risky assets gives you the minimum variance for\ a given rate of return.\ The efficient frontier is the set of mean-variance combinations from the minimum-variance frontier where, for a\ given risk, no other portfolio offers a higher expected return:\ Any point beneath the efficient frontier is inferior to points above. Moreover, any points along the efficient frontier\ are, by definition, superior to all other points for that combined risk-return tradeoff.\ The Requirements:\ Step 1: Choose seven (7) assets (preferably something with significant historical data)\ Step 2: Retrieve daily open or close data on your assets for the previous 2 years\ Step 3: Calculate the mean, variance, and correlation matrix for all assets\ Step 4: Calculate efficient frontier and optimal weights for your portfolio (Don't forget the output!)\ Step 5: Use MatPlotLib or Seaborn libraries to graph the results (matrix and frontier)\ Step 6: Output the calculated optimal weighting (identify portfolio weightings for optimum Sharpe Ratio)\ along with the efficient frontier and correlation matrix charts. Output to a saved file.\ You must define and use at least one (1) class to complete the project. There are multiple ways to calculate the\ efficient frontier. For this project, you must calculate and graph the efficient frontier using, at a minimum, a Monte-\ Carlo method. For extra points, you may also accomplish the project using Linear Regression. You will submit your\ python code file plus the output image.
Step by Step Solution
There are 3 Steps involved in it
Step: 1

Get Instant Access to Expert-Tailored Solutions
See step-by-step solutions with expert insights and AI powered tools for academic success
Step: 2

Step: 3
Ace Your Homework with AI
Get the answers you need in no time with our AI-driven, step-by-step assistance
Get Started
Methods And Finance
Authors: Emiliano Ippoliti, Ping Chen
1st Edition
3319498711, 978-3319498713