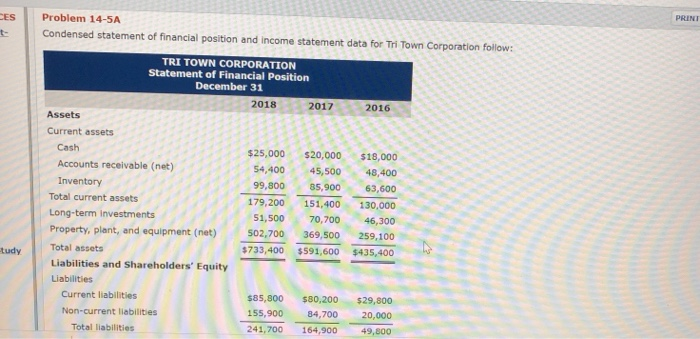
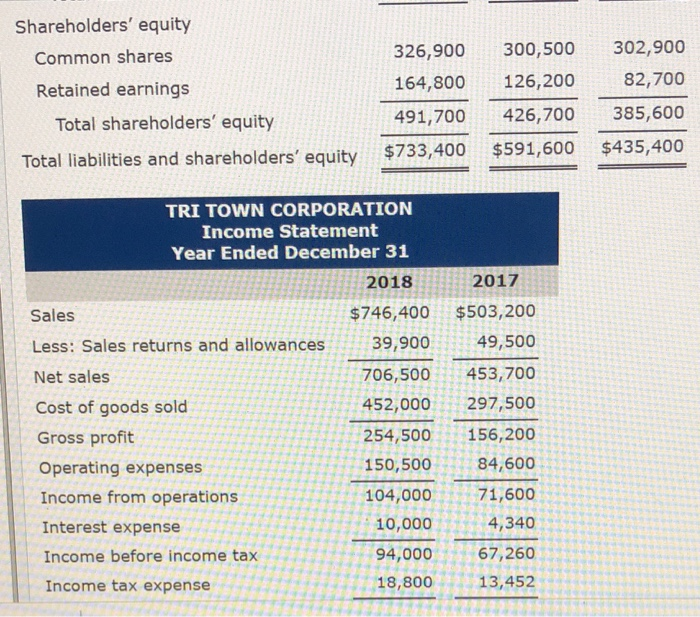
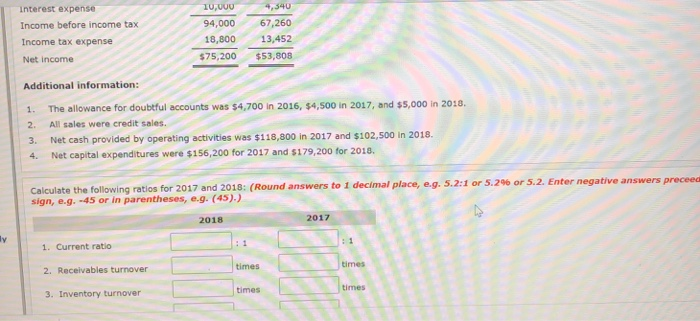
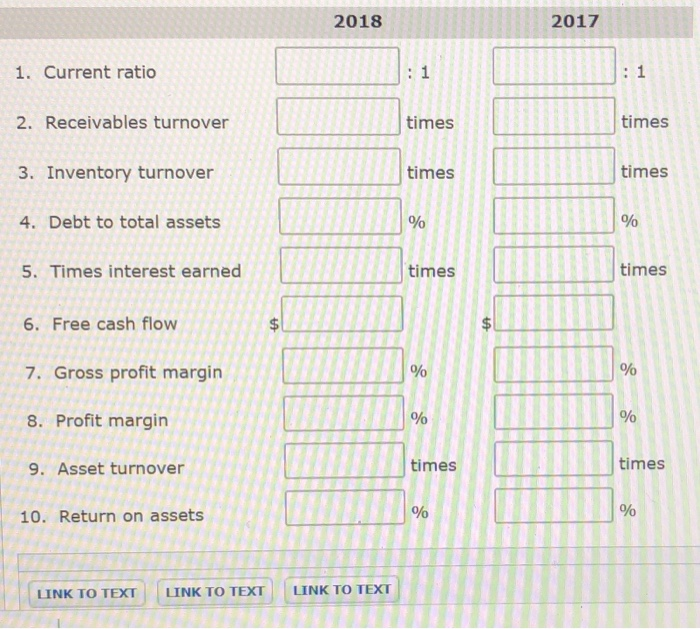
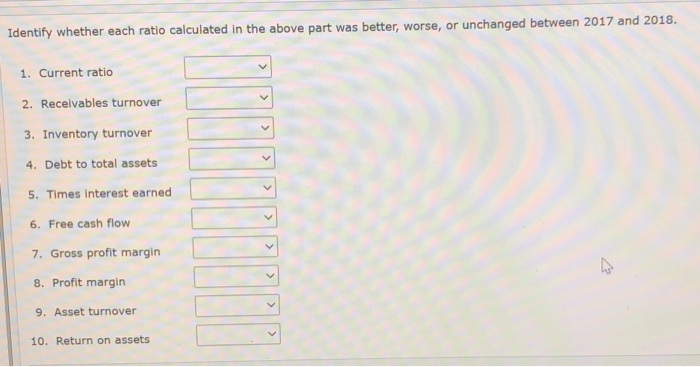
PRINI CES t- Problem 14-5A Condensed statement of financial position and income statement data for Thi Town Corporation follow: 2016 TRI TOWN CORPORATION Statement of Financial Position December 31 2018 2017 Assets Current assets Cash $25,000 $20,000 Accounts receivable (net) 54,400 45,500 Inventory 99,800 85,900 Total current assets 179,200 151,400 Long-term Investments 51,500 70,700 Property, plant, and equipment (net) 502,700 369,500 Total assets $ 733,400 $591,600 Liabilities and Shareholders' Equity Liabilities Current liabilities $85,800 $80,200 Non-current liabilities 155,900 84,700 Total liabilities 241,700 164,900 $18,000 48,400 63,600 130,000 46,300 259,100 $435,400 tudy $29,800 20,000 49,800 Shareholders' equity Common shares 326,900 Retained earnings 164,800 Total shareholders' equity 491,700 Total liabilities and shareholders' equity $733,400 300,500 126,200 426,700 302,900 82,700 385,600 $435,400 $591,600 2017 $503,200 49,500 TRI TOWN CORPORATION Income Statement Year Ended December 31 2018 Sales $746,400 Less: Sales returns and allowances 39,900 Net sales 706,500 Cost of goods sold 452,000 Gross profit 254,500 Operating expenses 150,500 Income from operations 104,000 Interest expense 10,000 Income before income tax 94,000 Income tax expense 18,800 453,700 297,500 156,200 84,600 71,600 4,340 67,260 13,452 Interest expense Income before income tax 10,000 94,000 18,800 $75,200 Income tax expense 67,260 13,452 $53,808 Net income 1. Additional information: The allowance for doubtful accounts was $4,700 in 2016, $4,500 in 2017, and $5,000 in 2018. 2. All sales were credit sales. 3. Net cash provided by operating activities was $118,800 in 2017 and $102,500 in 2018. Net capital expenditures were $156,200 for 2017 and $179,200 for 2018. 4. Calculate the following ratios for 2017 and 2018: (Round answers to 1 decimal place, e.g. 5.2:1 or 5.2% or 5.2. Enter negative answers preceed sign, e.g. -45 or in parentheses, e.g. (45).) 2018 2017 ly 1. Current ratio times times 2. Receivables turnover times times 3. Inventory turnover 2018 2017 1. Current ratio 1 1 2. Receivables turnover times times 3. Inventory turnover times times 4. Debt to total assets % % 5. Times interest earned times times 6. Free cash flow tA $ 7. Gross profit margin % % 8. Profit margin % % 9. Asset turnover times times 10. Return on assets % % LINK TO TEXT LINK TO TEXT LINK TO TEXT Identify whether each ratio calculated in the above part was better, worse, or unchanged between 2017 and 2018. 1. Current ratio 2. Receivables turnover 3. Inventory turnover 4. Debt to total assets 5. Times interest earned 6. Free cash flow 7. Gross profit margin 8. Profit margin 9. Asset turnover le 10. Return on assets Indicate whether overall (1) liquidity, (2) solvency, and (3) profitability improved, deteriorated, or remained the same between 2017 and 2018 (1) Liquidity (2) Solvency (3) Profitability
