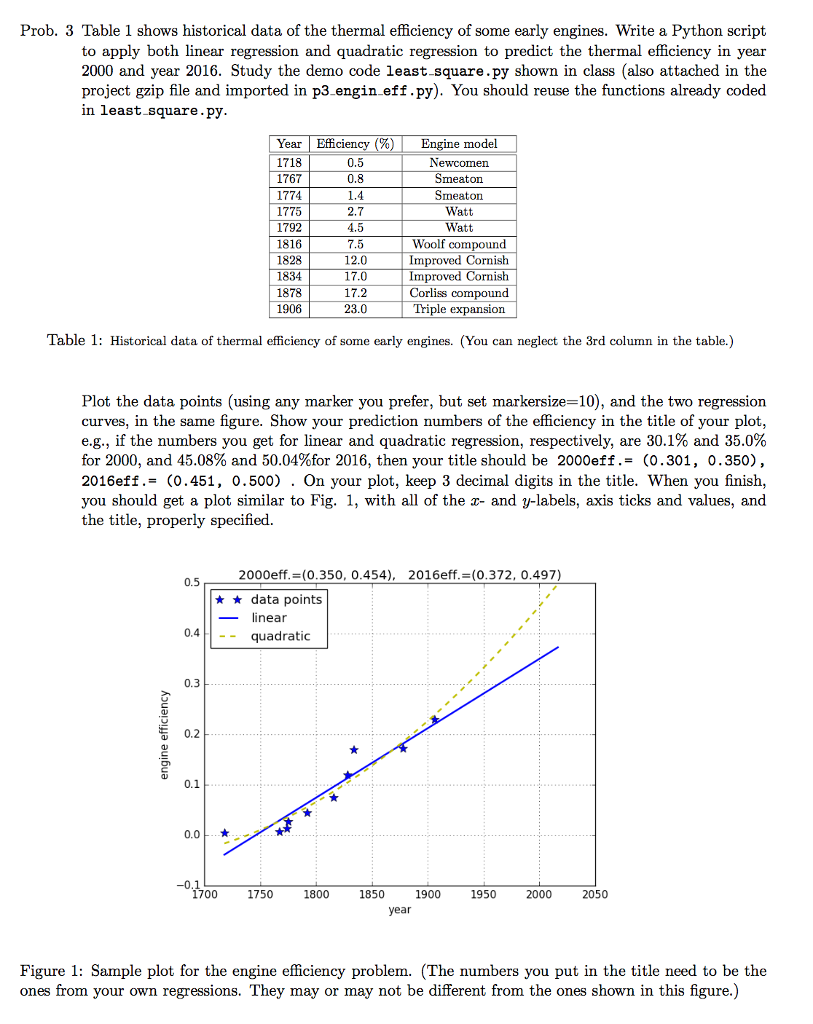
Prob. 3 Table 1 shows historical data of the thermal efficiency of some early engines. Write a Python script to apply both linear regression and quadratic regression to predict the thermal efficiency in year 2000 and year 2016. Study the demo code least.square.py shown in class (also attached in the project gzip file and imported in p3 engin eff.py). You should reuse the functions already coded in least square.py Year | Efficiency (%) 1718 1767 1774 1775 1792 Engine model 0.5 0.8 2.7 4.5 7.5 12.0 17.0 17.2 23.0 Smeaton Smeaton Watt Watt Woolf compound Improved Cornish Improved Cornish Corliss compound 1816 1834 1878 1906 Triple e on Table 1: Historical data of thermal efficiency of some early engines. (You can neglect the 3rd column in the table.) Plot the data points (using any marker you prefer, but set markersze=10), and the two regression curves, in the same figure. Show your prediction numbers of the efficiency in the title of your plot, e.g., if the numbers you get for linear and quadratic regression, respectively, are 30.1% and 35.0% for 2000, and 45.08% and 50.04%for 2016, then your title should be 2000eff'= (0.301, 0.350) , 2016eff.-(0.451, 0.500) . On your plot, keep 3 decimal digits in the title. When you finish, you should get a plot similar to Fig. 1, with all of the x- and y-labels, axis ticks and values, and the title, properly specified. 2000eff. (0.350, 0.454), 2016eff. (0.372, 0.497) 0.5 data points -linear 0.4Hquadratioc 0.3 1 0.2 0.0 -0.1 1700 1750 1800 1850 1900 1950 2000 2050 ear Figure 1: Sample plot for the engine efficiency problem. (The numbers you put in the title need to be the ones from your own regressions. They may or may not be different from the ones shown in this figure.) Prob. 3 Table 1 shows historical data of the thermal efficiency of some early engines. Write a Python script to apply both linear regression and quadratic regression to predict the thermal efficiency in year 2000 and year 2016. Study the demo code least.square.py shown in class (also attached in the project gzip file and imported in p3 engin eff.py). You should reuse the functions already coded in least square.py Year | Efficiency (%) 1718 1767 1774 1775 1792 Engine model 0.5 0.8 2.7 4.5 7.5 12.0 17.0 17.2 23.0 Smeaton Smeaton Watt Watt Woolf compound Improved Cornish Improved Cornish Corliss compound 1816 1834 1878 1906 Triple e on Table 1: Historical data of thermal efficiency of some early engines. (You can neglect the 3rd column in the table.) Plot the data points (using any marker you prefer, but set markersze=10), and the two regression curves, in the same figure. Show your prediction numbers of the efficiency in the title of your plot, e.g., if the numbers you get for linear and quadratic regression, respectively, are 30.1% and 35.0% for 2000, and 45.08% and 50.04%for 2016, then your title should be 2000eff'= (0.301, 0.350) , 2016eff.-(0.451, 0.500) . On your plot, keep 3 decimal digits in the title. When you finish, you should get a plot similar to Fig. 1, with all of the x- and y-labels, axis ticks and values, and the title, properly specified. 2000eff. (0.350, 0.454), 2016eff. (0.372, 0.497) 0.5 data points -linear 0.4Hquadratioc 0.3 1 0.2 0.0 -0.1 1700 1750 1800 1850 1900 1950 2000 2050 ear Figure 1: Sample plot for the engine efficiency problem. (The numbers you put in the title need to be the ones from your own regressions. They may or may not be different from the ones shown in this figure.)