Probability And Statistics In Engineering
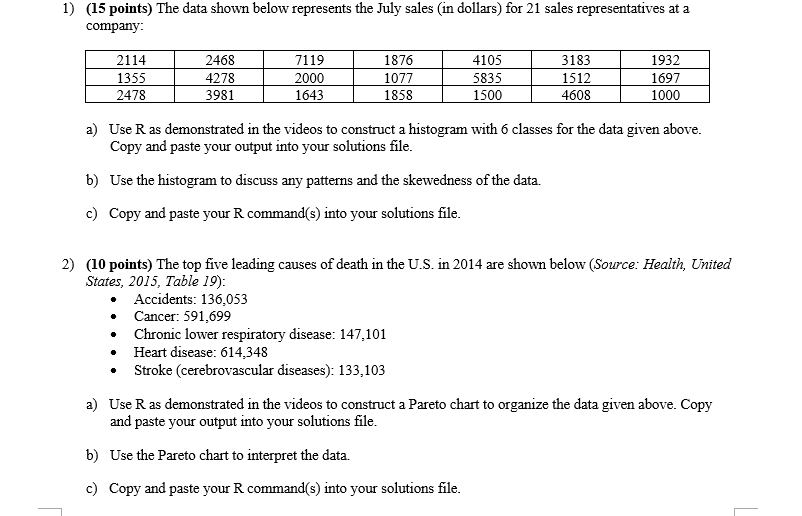
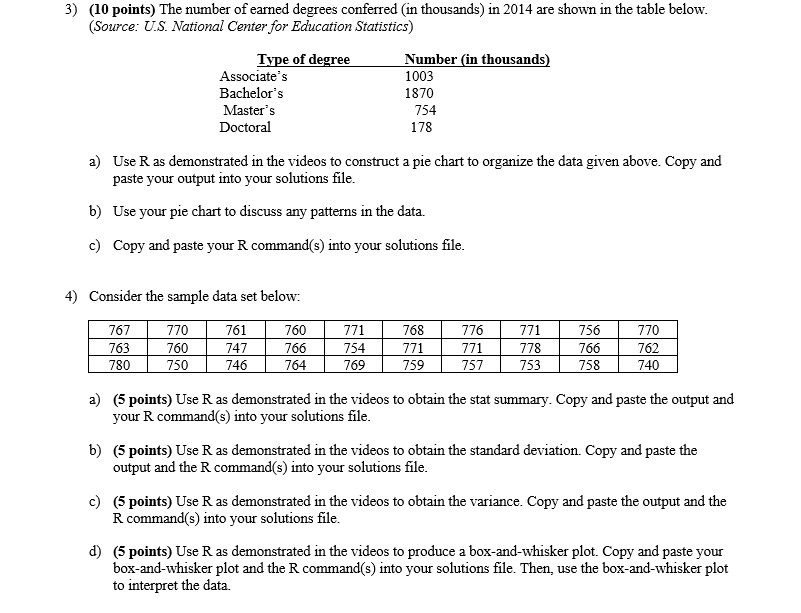
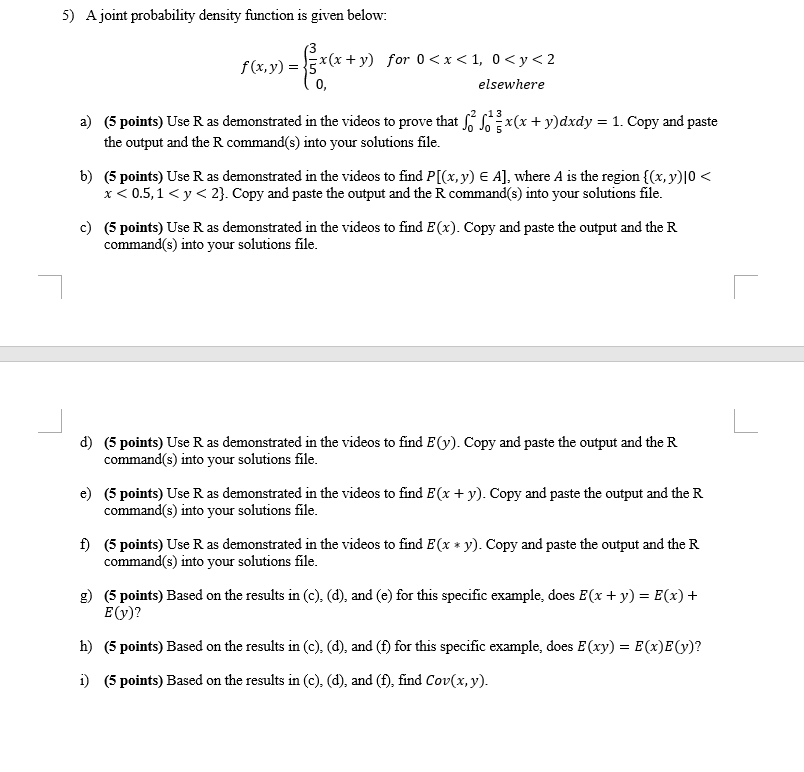
1) (15 points) The data shown below represents the July sales (in dollars) for 21 sales representatives at a company: 2114 2468 7119 1876 4105 3183 1932 1355 4278 2000 1077 5835 1512 1697 2478 3981 1643 1858 1500 4608 1000 a) Use R as demonstrated in the videos to construct a histogram with 6 classes for the data given above. Copy and paste your output into your solutions file. b) Use the histogram to discuss any patterns and the skewedness of the data. c) Copy and paste your R command(s) into your solutions file. 2) (10 points) The top five leading causes of death in the U.S. in 2014 are shown below (Source: Health, United States, 2015, Table 19): Accidents: 136,053 Cancer: 591,699 . Chronic lower respiratory disease: 147,101 Heart disease: 614,348 Stroke (cerebrovascular diseases): 133,103 a) Use R as demonstrated in the videos to construct a Pareto chart to organize the data given above. Copy and paste your output into your solutions file. b) Use the Pareto chart to interpret the data. c) Copy and paste your R command(s) into your solutions file.3) (10 points) The number of earned degrees conferred (in thousands) in 2014 are shown in the table below. (Source: U.S. National Center for Education Statistics) Type of degree Number (in thousands) Associate's 1003 Bachelor's 1870 Master's 754 Doctoral 178 a) Use R as demonstrated in the videos to construct a pie chart to organize the data given above. Copy and paste your output into your solutions file. b) Use your pie chart to discuss any patterns in the data. c) Copy and paste your R command(s) into your solutions file. 4) Consider the sample data set below: 767 770 761 760 771 768 776 771 756 770 763 760 747 766 754 771 77 778 766 762 780 750 746 764 769 759 757 753 758 740 a) (5 points) Use R as demonstrated in the videos to obtain the stat summary. Copy and paste the output and your R command(s) into your solutions file. b) (5 points) Use R as demonstrated in the videos to obtain the standard deviation. Copy and paste the output and the R command(s) into your solutions file. c) (5 points) Use R as demonstrated in the videos to obtain the variance. Copy and paste the output and the R command(s) into your solutions file. d) (5 points) Use R as demonstrated in the videos to produce a box-and-whisker plot. Copy and paste your box-and-whisker plot and the R command(s) into your solutions file. Then, use the box-and-whisker plot to interpret the data.5) A joint probability density function is given below: f ( x , y ) = 5 x (x+y) for 0


