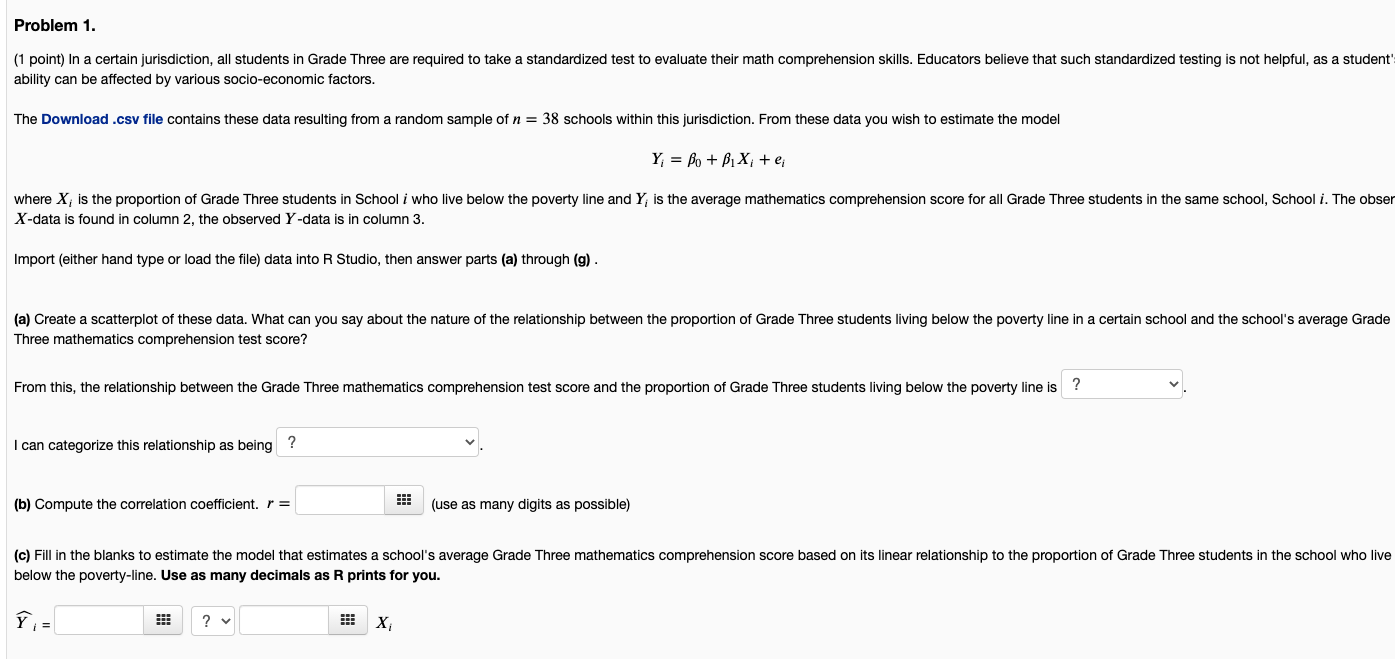
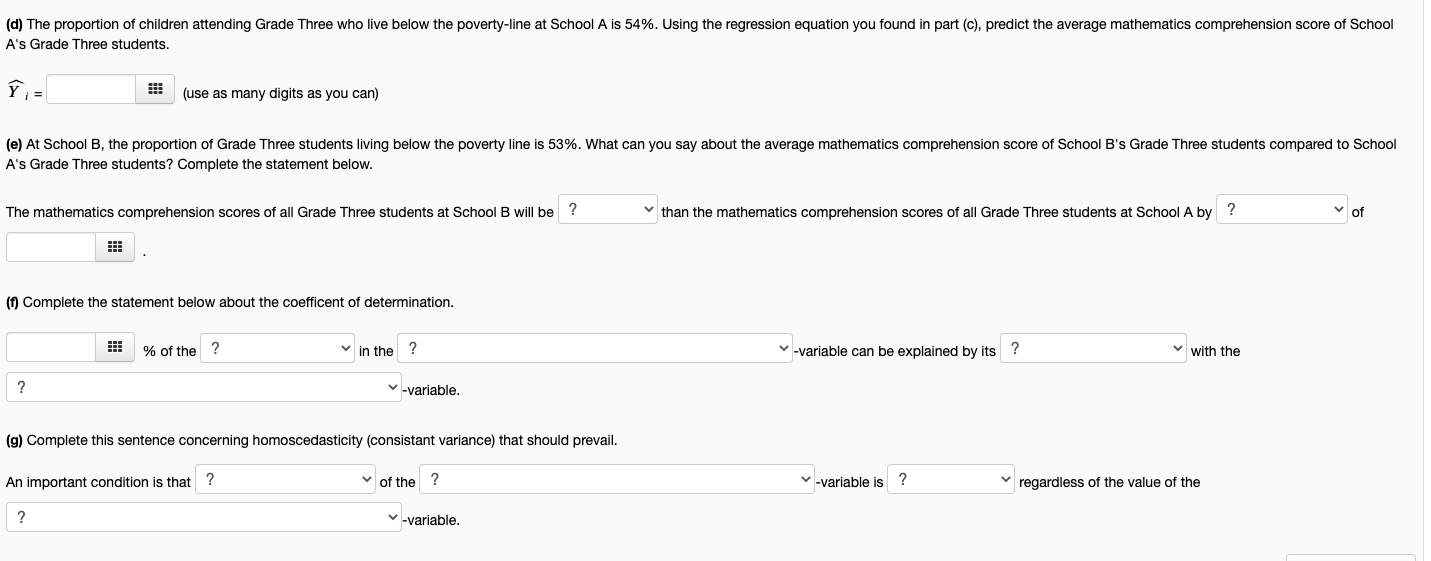
Problem 1. (1 point) In a certain jurisdiction, all students in Grade Three are required to take a standardized test to evaluate their math comprehension skills. Educators believe that such standardized testing is not helpful, as a student ability can be affected by various socio-economic factors. The Download .csv file contains these data resulting from a random sample of n = 38 schools within this jurisdiction. From these data you wish to estimate the model Y = Po+ BIXite; where X, is the proportion of Grade Three students in School i who live below the poverty line and Y, is the average mathematics comprehension score for all Grade Three students in the same school, School i. The obser X-data is found in column 2, the observed Y -data is in column 3. Import (either hand type or load the file) data into R Studio, then answer parts (a) through (9) . (a) Create a scatterplot of these data. What can you say about the nature of the relationship between the proportion of Grade Three students living below the poverty line in a certain school and the school's average Grade Three mathematics comprehension test score? From this, the relationship between the Grade Three mathematics comprehension test score and the proportion of Grade Three students living below the poverty line is ? I can categorize this relationship as being ? (b) Compute the correlation coefficient. r = (use as many digits as possible) (c) Fill in the blanks to estimate the model that estimates a school's average Grade Three mathematics comprehension score based on its linear relationship to the proportion of Grade Three students in the school who live below the poverty-line. Use as many decimals as R prints for you. Y = ? Xi(d) The proportion of children attending Grade Three who live below the poverty-line at School A is 54%. Using the regression equation you found in part (c), predict the average mathematics comprehension score of School A's Grade Three students. Y = (use as many digits as you can) (e) At School B, the proportion of Grade Three students living below the poverty line is 53%. What can you say about the average mathematics comprehension score of School B's Grade Three students compared to School A's Grade Three students? Complete the statement below. The mathematics comprehension scores of all Grade Three students at School B will be ? than the mathematics comprehension scores of all Grade Three students at School A by ? of (f) Complete the statement below about the coefficent of determination. % of the ? in the ? -variable can be explained by its ? with the 2 v-variable. (g) Complete this sentence concerning homoscedasticity (consistant variance) that should prevail. An important condition is that ? of the ? -variable is ? regardless of the value of the ? v-variable.filec60b1c6c949a perbelowpoverty| mathscore 42 88 194.59 2 58.57 164.72 56.41 171.8 54.38 179.63 58.95 159.66 62.63 166,4 45.16 184.36 61.93 165.66 59.58 163.22 10 52.79 172.47 11 62.38 161.19 12 54.69 179.88 67.33 165.74 14 61.93 168 86 15 71.91 165.46 18 42.81 187.18 17 65.24 169.5 10 59.27 168 51 19 57.68 171.03 20 55.2 179.84 21 50,06 174.38 45.23 179.12 77.69 159.13 24 50.82 175.92 25 58.19 177.74 28 57.49 171.46 27 48.21 176.88 20 54.76 173.43 29 59.33 175.08 30 56.53 169.57 31 61.56 177.19 32 59.71 157.79 69.24 154.16 34 60.54 165.18 51.96 179.58 54.25 180.37 37 55.96 167 02 48.85 165.86


