Question: Problem 1 (14 points) You are interested in studying the association between HDL HI (Y-variable) and AGE HI (X-variable). For this problem, examine whether GENDER
Problem 1 (14 points) You are interested in studying the association between HDL HI (Y-variable) and AGE HI (X-variable). For this problem, examine whether GENDER modifies the association between HDL HI and AGE HI. In other words, you need to test the interaction between AGE HI and GENDER. If there is an interaction between AGE HI and GENDER, what would you do next? Make sure to interpret your results (including interpreting the odds ratio). For this problem, you don't need to evaluate the confounding effect.
data chol_new; set chol; hdl_hi=hdl>47; age_hi=age>17; tg_hi=tg>68; bmi_hi=bmi>3.0718476;run;ods graphics on;proc logistic data=chol_new plots(only)=(effect (x=(age_hi) sliceby=gender) oddsratio (type=horizontalstat)); class gender ; model hdl_hi(event='1')=age_hi gender age_hi*gender;/* unit age_hi=10; */ oddsratio 'age_hi 10 vs 20 for male' age_hi/at(gender='male' age_hi=1) cl=pl; oddsratio 'age_hi 10 vs 20 for female' age_hi/at(gender='female' age_hi=1) cl=pl;run;ods graphics off;
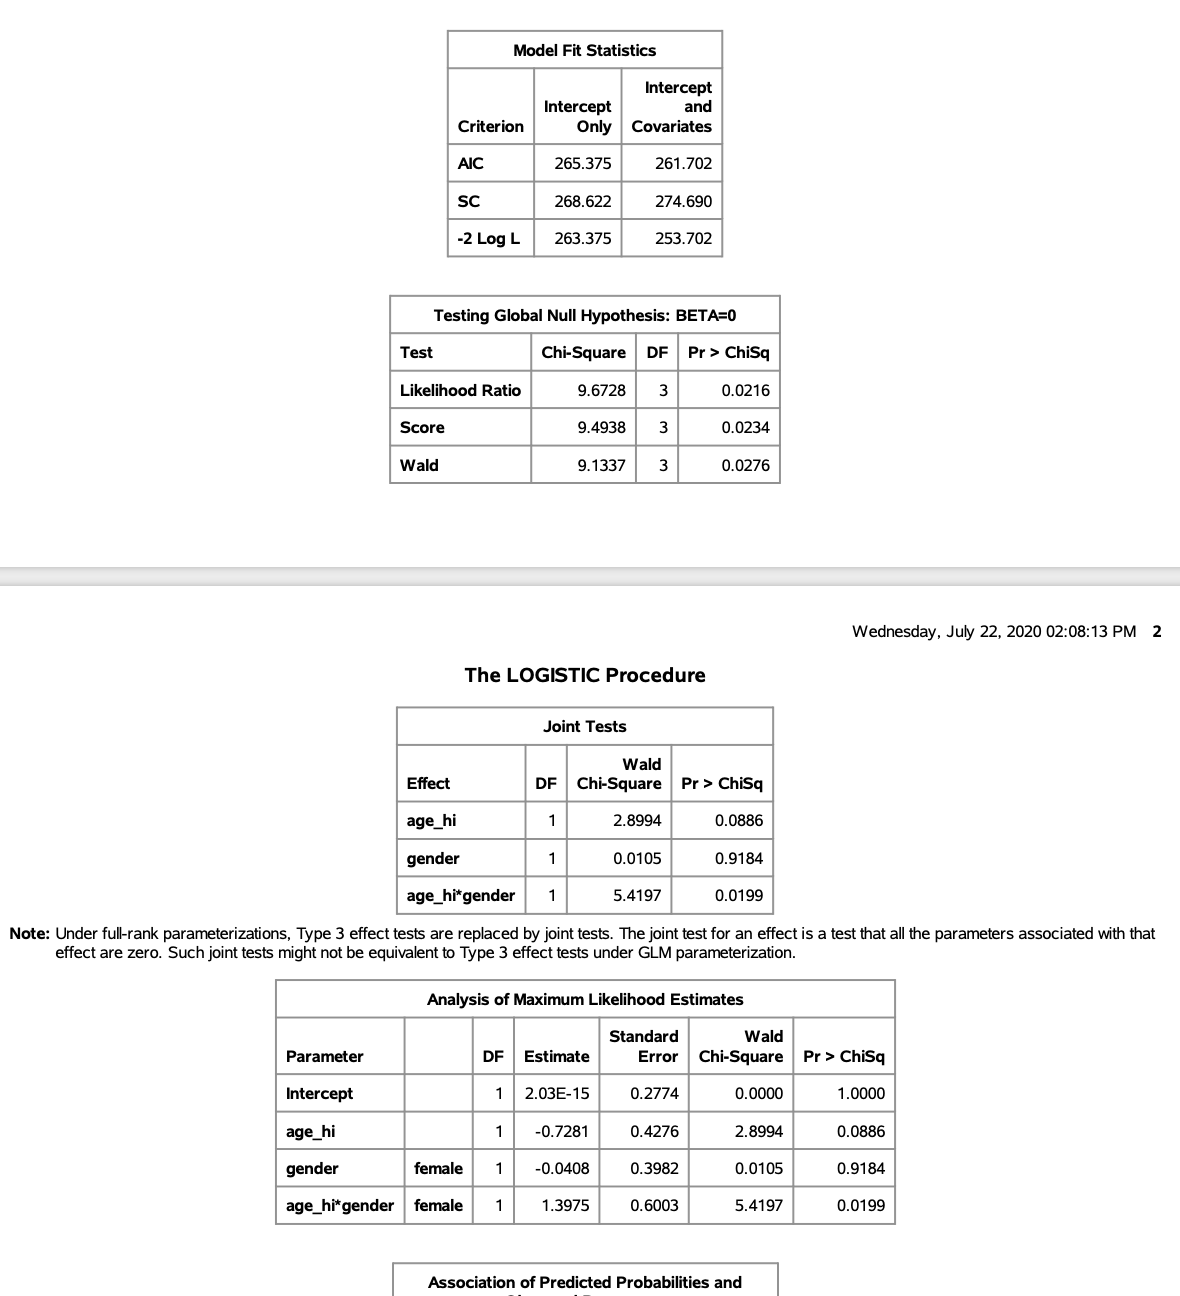
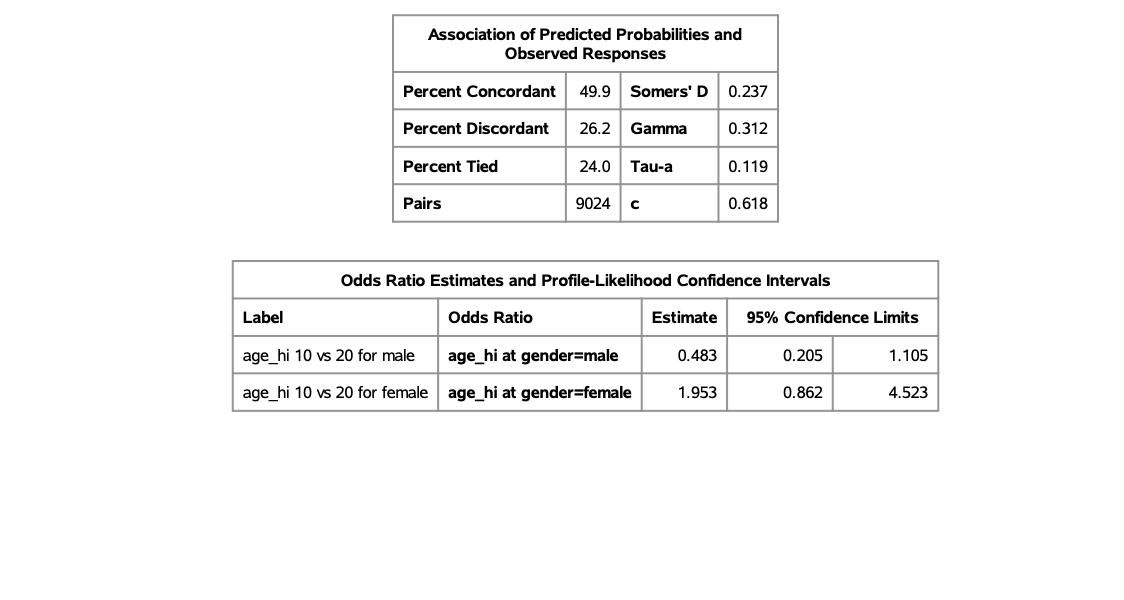
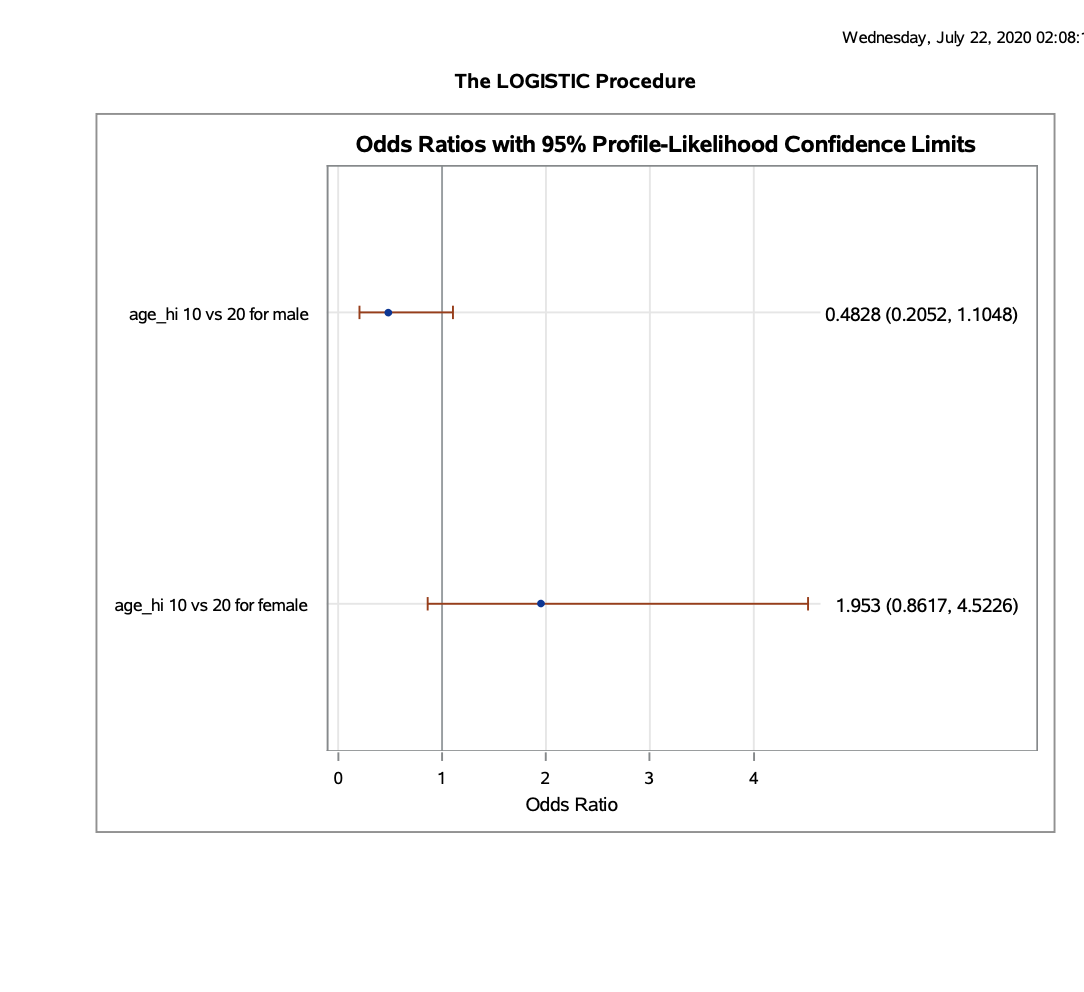
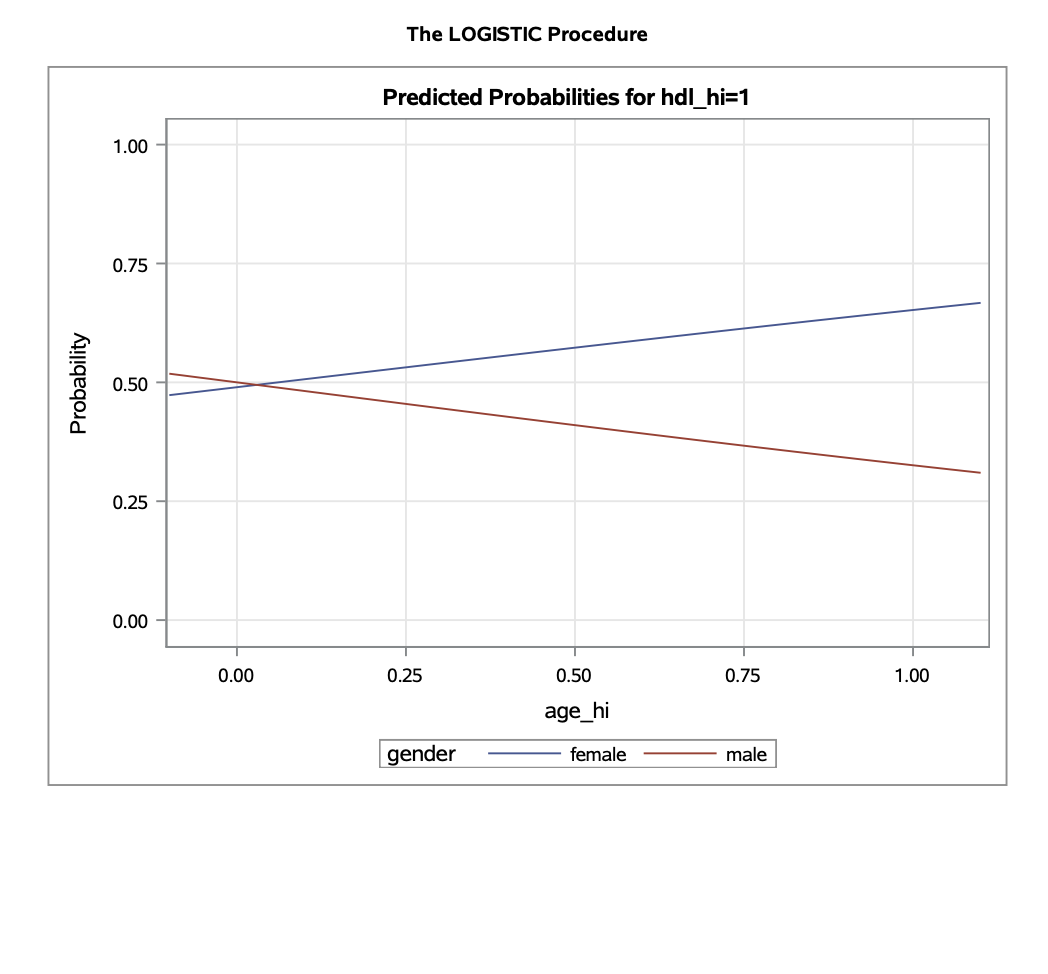
Need help to interpret the attached results that i got by running the above code.


Model Fit Statistics Intercept Intercept and Criterion Only Covariates AIC 265.375 261.702 SC 268.622 274.690 -2 Log L 263.375 253.702 Testing Global Null Hypothesis: BETA=0 Tes Chi-Square DF Pr > ChiSq Likelihood Ratio 9.6728 3 0.0216 Score 9.4938 3 0.0234 Wald 9.1337 3 0.0276 Wednesday, July 22, 2020 02:08:13 PM 2 The LOGISTIC Procedure Joint Tests Wald Effect DE Chi-Square Pr > ChiSq age hi 2.8994 0.0886 gender 0.0105 0.9184 age_hi*gender 5.4197 0.0199 Note: Under full-rank parameterizations, Type 3 effect tests are replaced by joint tests. The joint test for an effect is a test that all the parameters associated with that effect are zero. Such joint tests might not be equivalent to Type 3 effect tests under GLM parameterization Analysis of Maximum Likelihood Estimates Standard Wald Parameter DF Estimat Error Chi-Square Pr > ChiSq Intercept 1 2.03E-15 0.2774 0.0000 1.0000 age_hi -0.7281 0.4276 2.8994 0.0886 gender female 1 -0.0408 0.3982 0.0105 0.9184 age_hi* gender female 1 1.3975 0.6003 5.4197 0.0199 Association of Predicted Probabilities andAssociation of Predicted Probabilities and Observed Responses Percent Concordant 49.9 Somers' D 0.237 Percent Discordant 26.2 Gamma 0.312 Percent Tied 24.0 Tau-a 0. 119 Pairs 9024 C 0.618 Odds Ratio Estimates and Profile-Likelihood Confidence Intervals Label Odds Ratio Estimate 95% Confidence Limits age_hi 10 vs 20 for male age_hi at gender=male 0.483 0.205 1.105 age_hi 10 vs 20 for female age_hi at gender=female 1.953 0.862 4.523Wednesday, July 22, 2020 02:08: The LOGISTIC Procedure Odds Ratios with 95% Profile-Likelihood Confidence Limits age_hi 10 vs 20 for male 0.4828 (0.2052, 1.1048) age_hi 10 vs 20 for female 1.953 (0.8617, 4.5226) 1 2 3 4 Odds RatioThe LOGISTIC Procedure Predicted Probabilities for hdl_hi=1 1.00 0.75 Probability 0.50 0.25 0.00 0.00 0.25 0.50 0.75 1.00 age hi gender female male
Step by Step Solution
There are 3 Steps involved in it

Get step-by-step solutions from verified subject matter experts


