Problem 1. [7 marks] A data set on gas consumption of 30 cars includes the following variables: y gas consumption (in milesfgallon). 9:1 engine size
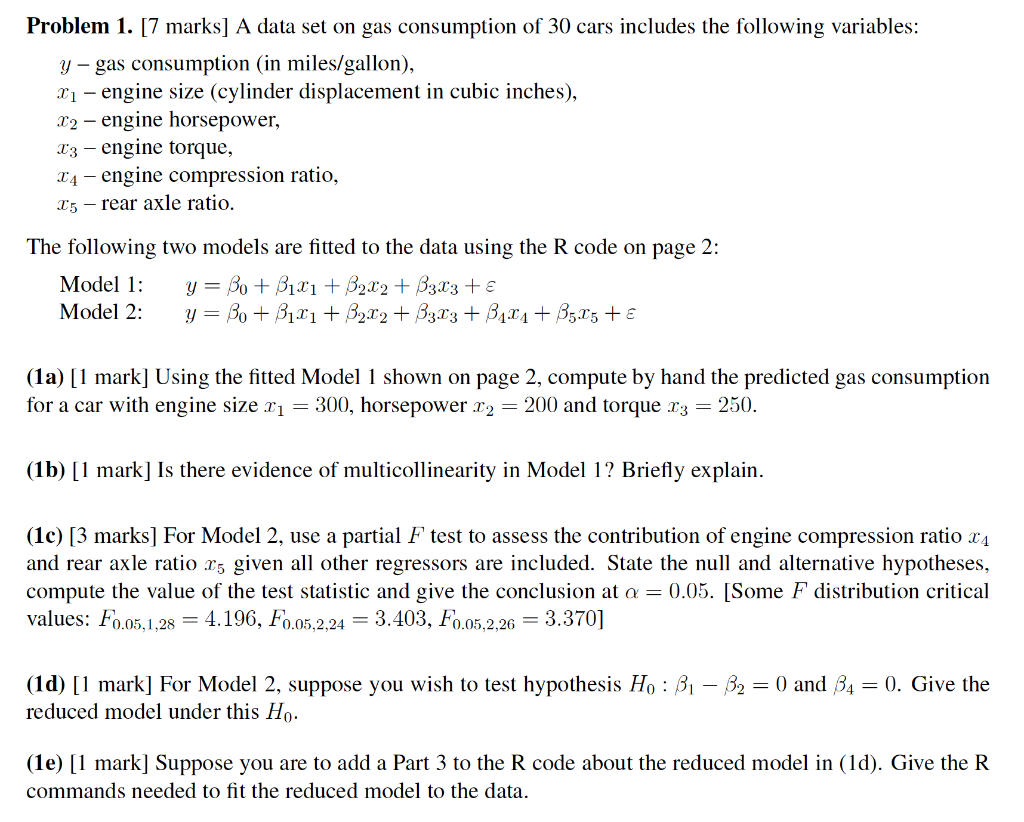
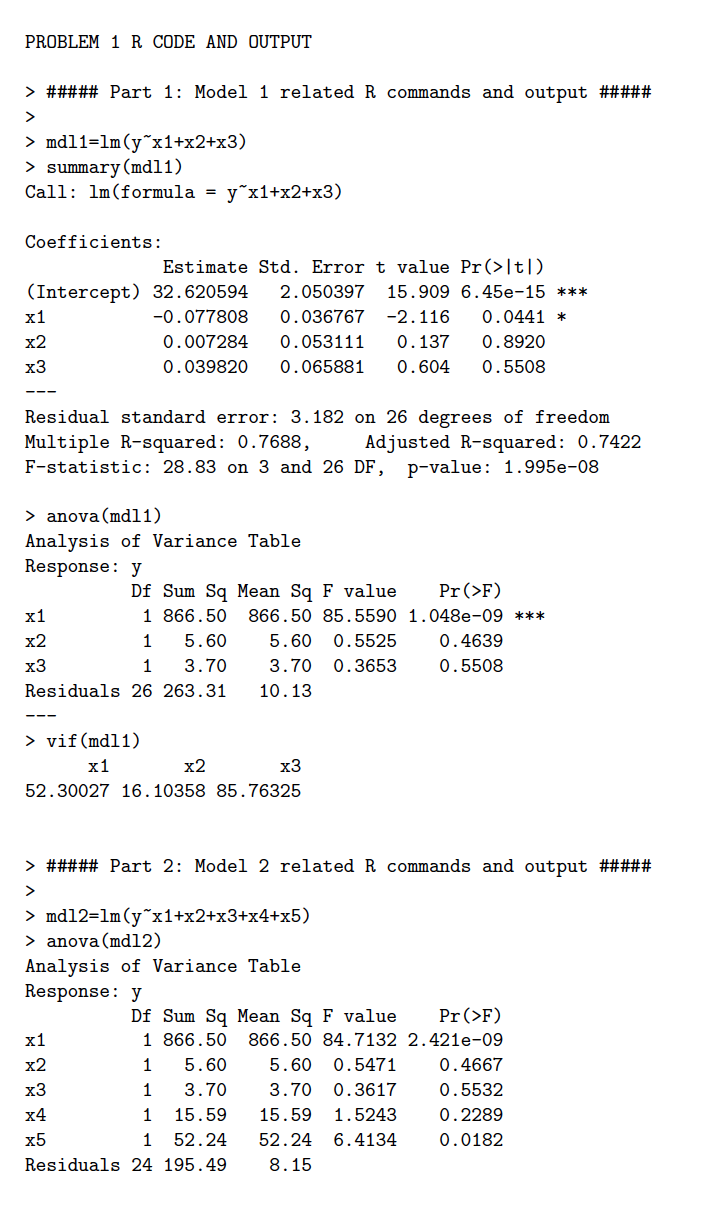
Problem 1. [7 marks] A data set on gas consumption of 30 cars includes the following variables: y gas consumption (in milesfgallon). 9:1 engine size (cylinder displacement in cubic inches). 222 engine horsepower, 1:3 engine torque, 3:4 engine compression ratio, 2:5 rear axle ratio. The following two models are tted to the data using the R code on page 2: Mode] l: y = ,6.) + 511?] 32322 + 63553 + 5' Model 23 .1} = 50 + 51331 + .32332 + #33173 + H3413: + 55335 + 5 (la) [1 mark] Using the tted Model 1 shown on page 2, compute by hand the predicted gas consumption for a car with engine size 331 = 300, horsepower 332 = 200 and torque 3:3 2 250. (1b) [1 mark] Is there evidence ofmulticollinearity in Model 1'? Briey explain. (1c) [3 marks] For Model 2, use a partial F test to assess the contribution of engine compression ratio 3:4 and rear axle ratio 3:5 given all other regressors are included. State the null and alternative hypotheses, compute the value of the test statistic and give the conclusion at or = 0.05. [Some F distribution critical VBIUCSI I'hnjhgg = 4.196, fh_n5j2'g4 = 3.403, fhmgjgr, = 3.370] (111) [1 mark] For Model 2. suppose you wish to test hypothesis Hr} : [3'1 .82 = {l and {5'4 = 0. Give the reduced model under this Ho. (1e) [1 mark] Suppose you are to add a Part 3 to the R code about the reduced model in (1d). Give the R commands needed to t the reduced model to the data. PROBLEM 1 R CODE AND OUTPUT > #### Part 1: Model 1 related R commands and output #### > > mdl1=1m(y"x1+x2+x3) > summary (mdl1) Call: Im(formula = y"x1+x2+x3) Coefficients: Estimate Std. Error t value Pr(>|t/) (Intercept) 32. 620594 2. 050397 15.909 6. 45e-15 *** x1 -0. 077808 0. 036767 -2. 116 0 . 0441 * x2 0. 007284 0. 053111 0. 137 0. 8920 x3 0. 039820 0. 065881 0 . 604 0. 5508 Residual standard error: 3.182 on 26 degrees of freedom Multiple R-squared: 0.7688, Adjusted R-squared: 0.7422 F-statistic: 28.83 on 3 and 26 DF, p-value: 1.995e-08 > anova (mdl1) Analysis of Variance Table Response : y Of Sum Sq Mean Sq F value Pr (>F) x1 1 866.50 866.50 85. 5590 1. 048e-09 *** x2 1 5. 60 5.60 0. 5525 0. 4639 x3 1 3.70 3.70 0.3653 0 . 5508 Residuals 26 263.31 10. 13 > vif (mdl1) x1 x2 x3 52. 30027 16. 10358 85.76325 > ##### Part 2: Model 2 related R commands and output ##### > > mdl2=1m(y"x1+x2+x3+x4+x5) > anova (md12) Analysis of Variance Table Response : y Df Sum Sq Mean Sq F value Pr(>F) x1 1 866.50 866.50 84.7132 2. 421e-09 x2 5.60 5.60 0.5471 0. 4667 x3 3.70 3.70 0. 3617 0. 5532 x4 1 15.59 15.59 1.5243 0. 2289 x5 1 52.24 52.24 6.4134 0. 0182 Residuals 24 195.49 8. 15
Step by Step Solution
There are 3 Steps involved in it
Step: 1
Get Instant Access to Expert-Tailored Solutions
See step-by-step solutions with expert insights and AI powered tools for academic success
Step: 2
Step: 3
Ace Your Homework with AI
Get the answers you need in no time with our AI-driven, step-by-step assistance