Answered step by step
Verified Expert Solution
Question
1 Approved Answer
Problem 1. Based on Figure 12.5, follow the isotherm at 175 C, increasing pressure from P =0 to the critical line (at constant T). a)
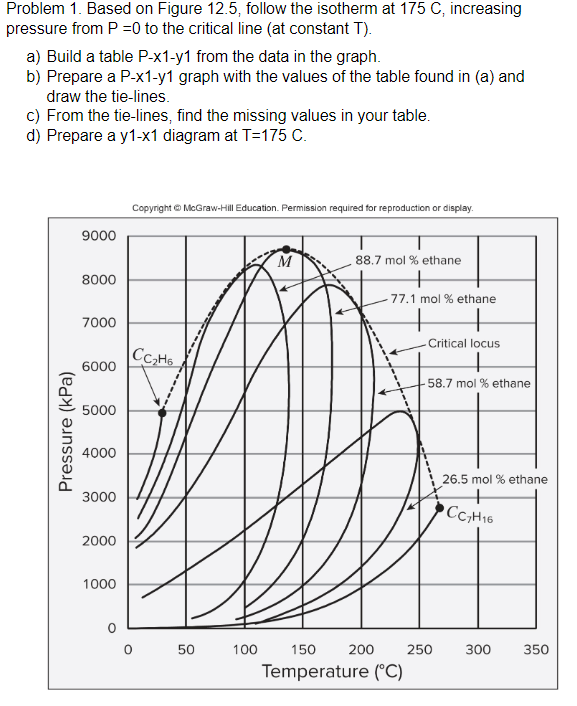
Problem 1. Based on Figure 12.5, follow the isotherm at 175 C, increasing pressure from P =0 to the critical line (at constant T). a) Build a table P-x1-y1 from the data in the graph. b) Prepare a P-x1-y1 graph with the values of the table found in (a) and draw the tie-lines. c) From the tie-lines, find the missing values in your table. d) Prepare a y1-x1 diagram at T=175 C. Copyright McGraw-Hill Education. Permission required for reproduction or display. 9000 M 8000 88.7 mol % ethane + -77.1 mol % ethane 7000 Critical locus 6000 |Ccato 58.7 mol % ethane 5000 Pressure (kPa) 4000 26.5 mol % ethane 3000 CC,H16 2000 1000 50 300 350 100 150 200 250 Temperature (C)
Step by Step Solution
There are 3 Steps involved in it
Step: 1
Get Instant Access to Expert-Tailored Solutions
See step-by-step solutions with expert insights and AI powered tools for academic success
Step: 2
Step: 3
Ace Your Homework with AI
Get the answers you need in no time with our AI-driven, step-by-step assistance
Get Started