

Answered step by step
Verified Expert Solution
Question
1 Approved Answer
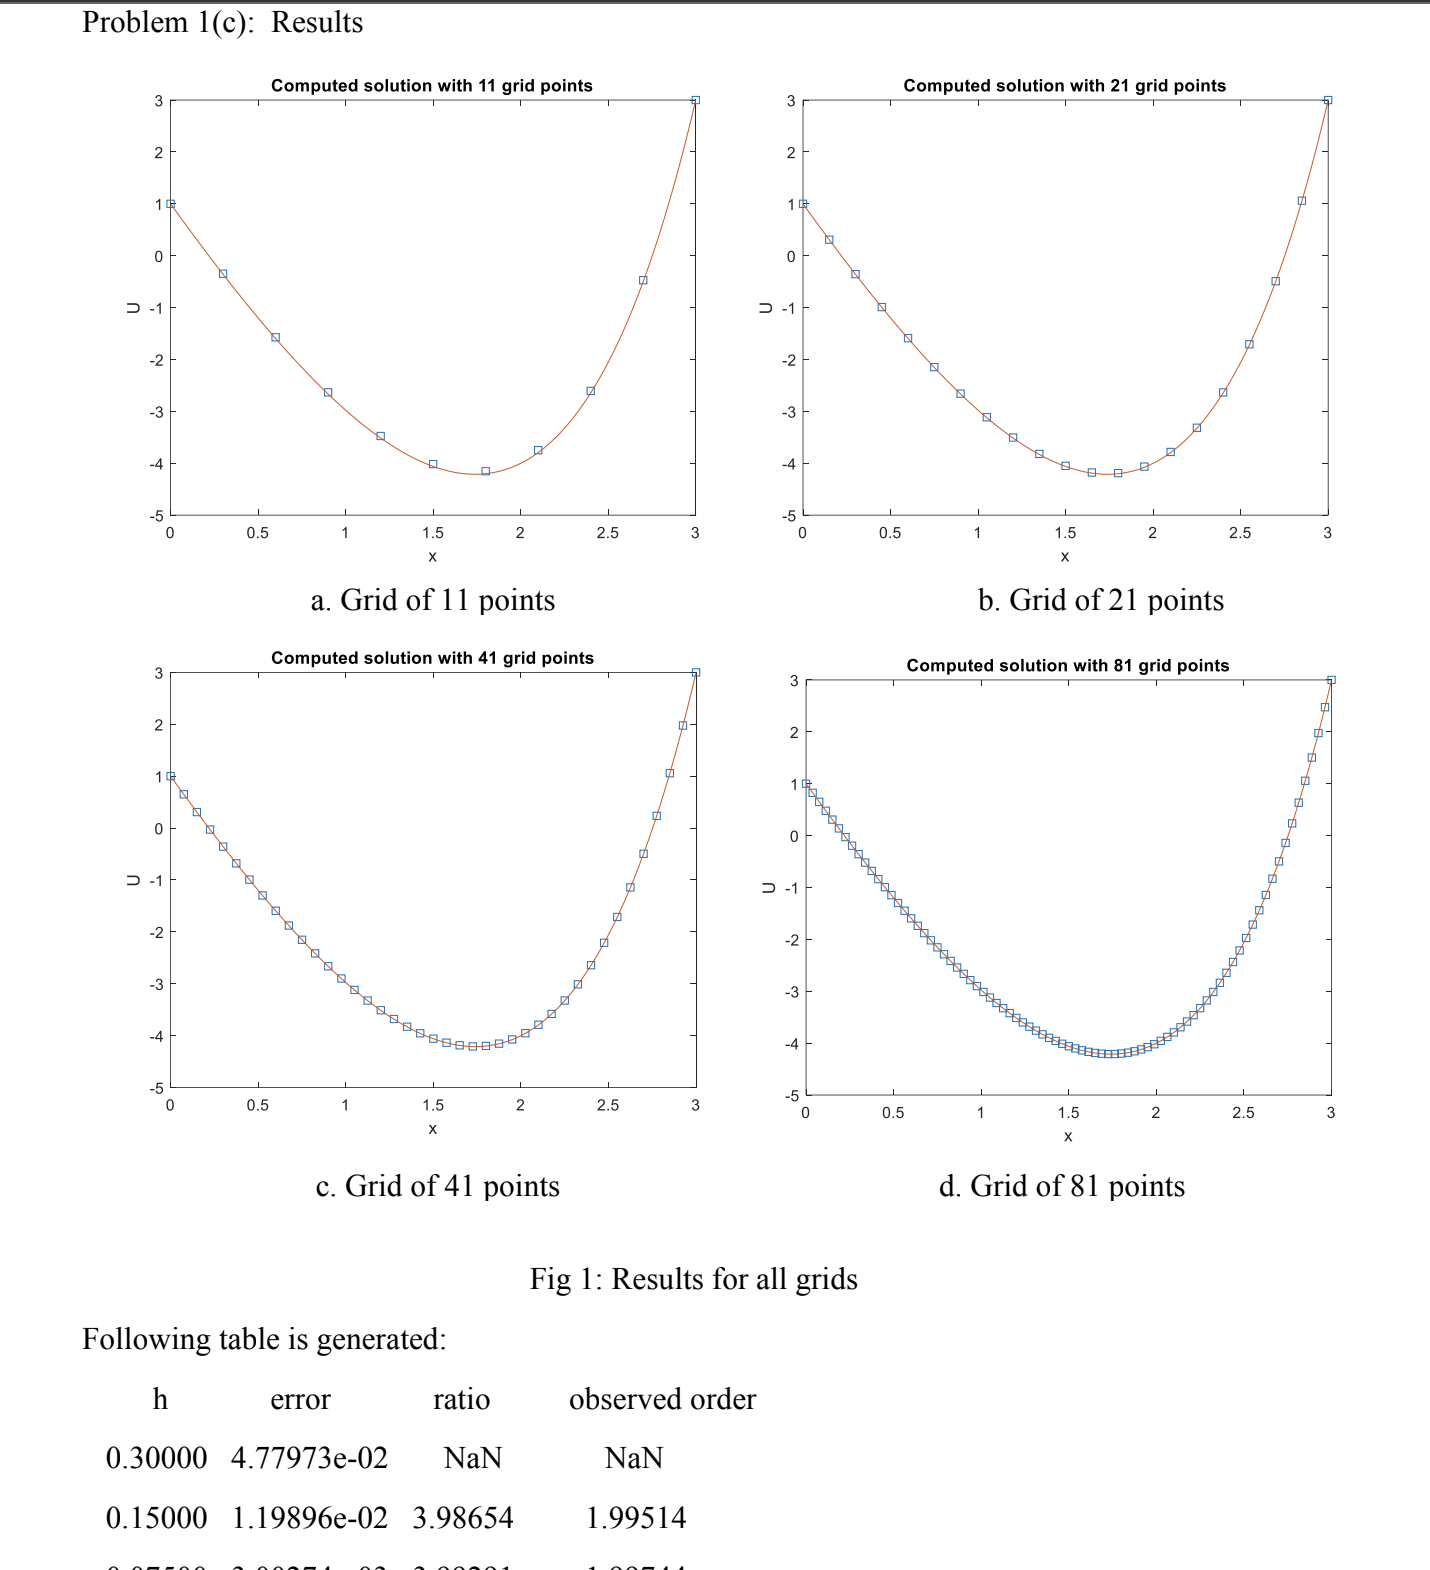
Problem 1 ( c ) : Results a . Grid of 1 1 points b . Grid of 2 1 points c . Grid of
Problem c: Results
a Grid of points
b Grid of points
c Grid of points
d Grid of points
Fig : Results for all grids
Following table is generated:
h error ratio observed order
e NaN NaN
e
e
e
Write a python code to the following matlab code.
clc;clear;close all;
Problemc
a ;
b ;
sigma ;
beta ;
mplus;
f @x expx;
True solution
utrue @x expxbetasigmaexpaexpbbax
bsigmaabetaaexpbbexpaba;
True solution on fine grid for plotting
xfine linspaceab;
ufine utruexfine;
Solve for multiple grids
hvals zerosnumelmplus;
error zerosnumelmplus;
for i :numelmplus
run routine for finite diff solve
xhvalsiu finitedifferencecabsigma,beta,mplusif;
get error at grid points
uhat utruex;
err u uhat;
errori maxabserr;
disp
dispsprintfError with i points is emplusierrori
clf
plotxus plot computed solution
titlesprintfComputed solution with i grid points',mplusi;
hold on
plotxfineufine plot true solution
xlabelx
ylabelU
hold off
drawnow
inputHit to continue ;
clear x u
end
errortablehvalserror; print tables of errors and ratios
errorlogloghvalserror; produce loglog plot of errors and least squares
fit
Step by Step Solution
There are 3 Steps involved in it
Step: 1

Get Instant Access to Expert-Tailored Solutions
See step-by-step solutions with expert insights and AI powered tools for academic success
Step: 2

Step: 3
Ace Your Homework with AI
Get the answers you need in no time with our AI-driven, step-by-step assistance
Get Started
Power Bi And Azure Integrating Cloud Analytics For Scalable Solutions
Authors: Kiet Huynh
1st Edition
B0CMHKB85L, 979-8868959943