

Answered step by step
Verified Expert Solution
Question
1 Approved Answer
Problem 1: Calculate the expected annualized return and annualized standard deviation of the three stocks you've picked and for one of the indices ($SPY for
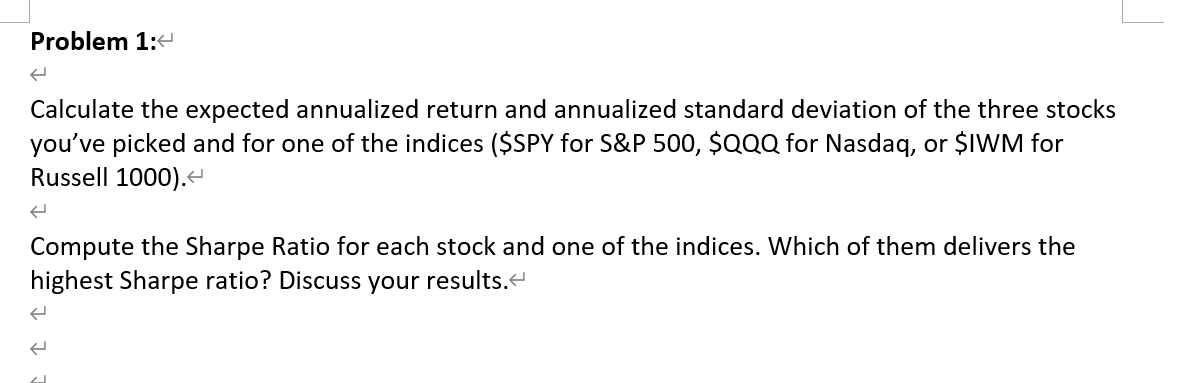
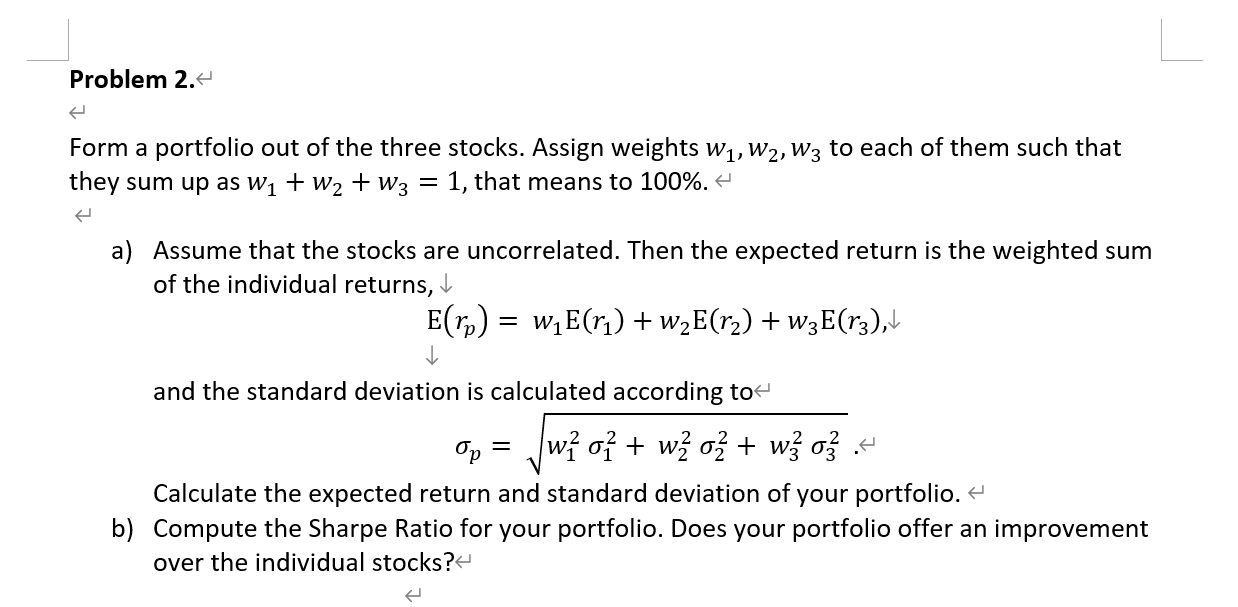
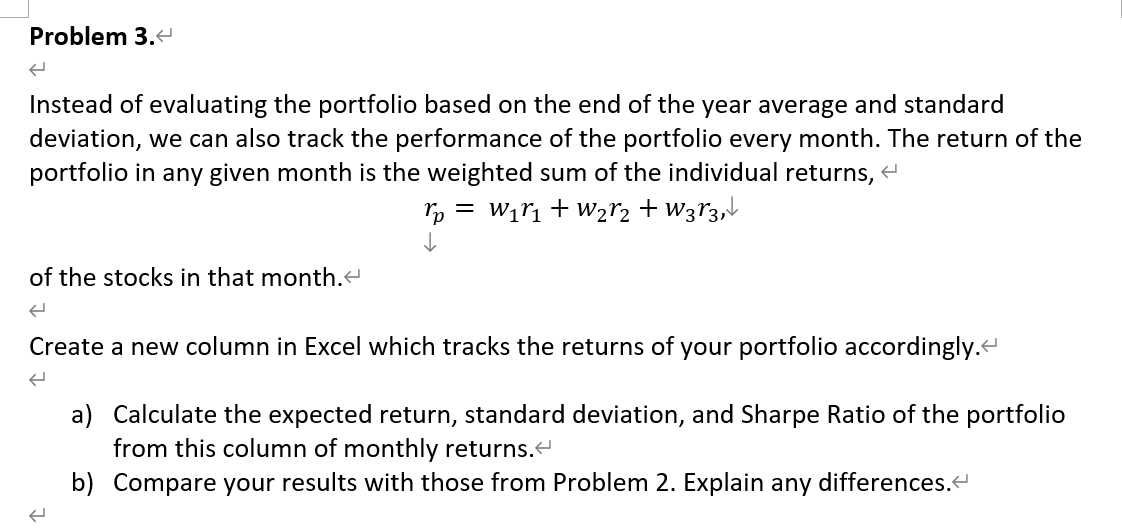
 Problem 1: Calculate the expected annualized return and annualized standard deviation of the three stocks you've picked and for one of the indices (\$SPY for S\&P 500, \$QQQ for Nasdaq, or \$IWM for Russell 1000). Compute the Sharpe Ratio for each stock and one of the indices. Which of them delivers the highest Sharpe ratio? Discuss your results. Instead of evaluating the portfolio based on the end of the year average and standard deviation, we can also track the performance of the portfolio every month. The return of the portfolio in any given month is the weighted sum of the individual returns, rp=w1r1+w2r2+w3r3, of the stocks in that month. Create a new column in Excel which tracks the returns of your portfolio accordingly. a) Calculate the expected return, standard deviation, and Sharpe Ratio of the portfolio from this column of monthly returns. b) Compare your results with those from Problem 2. Explain any differences. Form a portfolio out of the three stocks. Assign weights w1,w2,w3 to each of them such that they sum up as w1+w2+w3=1, that means to 100%. a) Assume that the stocks are uncorrelated. Then the expected return is the weighted sum of the individual returns, E(rp)=w1E(r1)+w2E(r2)+w3E(r3), and the standard deviation is calculated according to p=w1212+w2222+w3232. Calculate the expected return and standard deviation of your portfolio. b) Compute the Sharpe Ratio for your portfolio. Does your portfolio offer an improvement over the individual stocks? Problem 1: Calculate the expected annualized return and annualized standard deviation of the three stocks you've picked and for one of the indices (\$SPY for S\&P 500, \$QQQ for Nasdaq, or \$IWM for Russell 1000). Compute the Sharpe Ratio for each stock and one of the indices. Which of them delivers the highest Sharpe ratio? Discuss your results. Instead of evaluating the portfolio based on the end of the year average and standard deviation, we can also track the performance of the portfolio every month. The return of the portfolio in any given month is the weighted sum of the individual returns, rp=w1r1+w2r2+w3r3, of the stocks in that month. Create a new column in Excel which tracks the returns of your portfolio accordingly. a) Calculate the expected return, standard deviation, and Sharpe Ratio of the portfolio from this column of monthly returns. b) Compare your results with those from Problem 2. Explain any differences. Form a portfolio out of the three stocks. Assign weights w1,w2,w3 to each of them such that they sum up as w1+w2+w3=1, that means to 100%. a) Assume that the stocks are uncorrelated. Then the expected return is the weighted sum of the individual returns, E(rp)=w1E(r1)+w2E(r2)+w3E(r3), and the standard deviation is calculated according to p=w1212+w2222+w3232. Calculate the expected return and standard deviation of your portfolio. b) Compute the Sharpe Ratio for your portfolio. Does your portfolio offer an improvement over the individual stocks
 Step by Step Solution
There are 3 Steps involved in it
Step: 1

Get Instant Access to Expert-Tailored Solutions
See step-by-step solutions with expert insights and AI powered tools for academic success
Step: 2

Step: 3
Ace Your Homework with AI
Get the answers you need in no time with our AI-driven, step-by-step assistance
Get Started
Contemporary Financial Management
Authors: R. Charles Moyer, William J. Kretlow, James R. Mcguigan
8th Edition
0324065914, 9780324065916