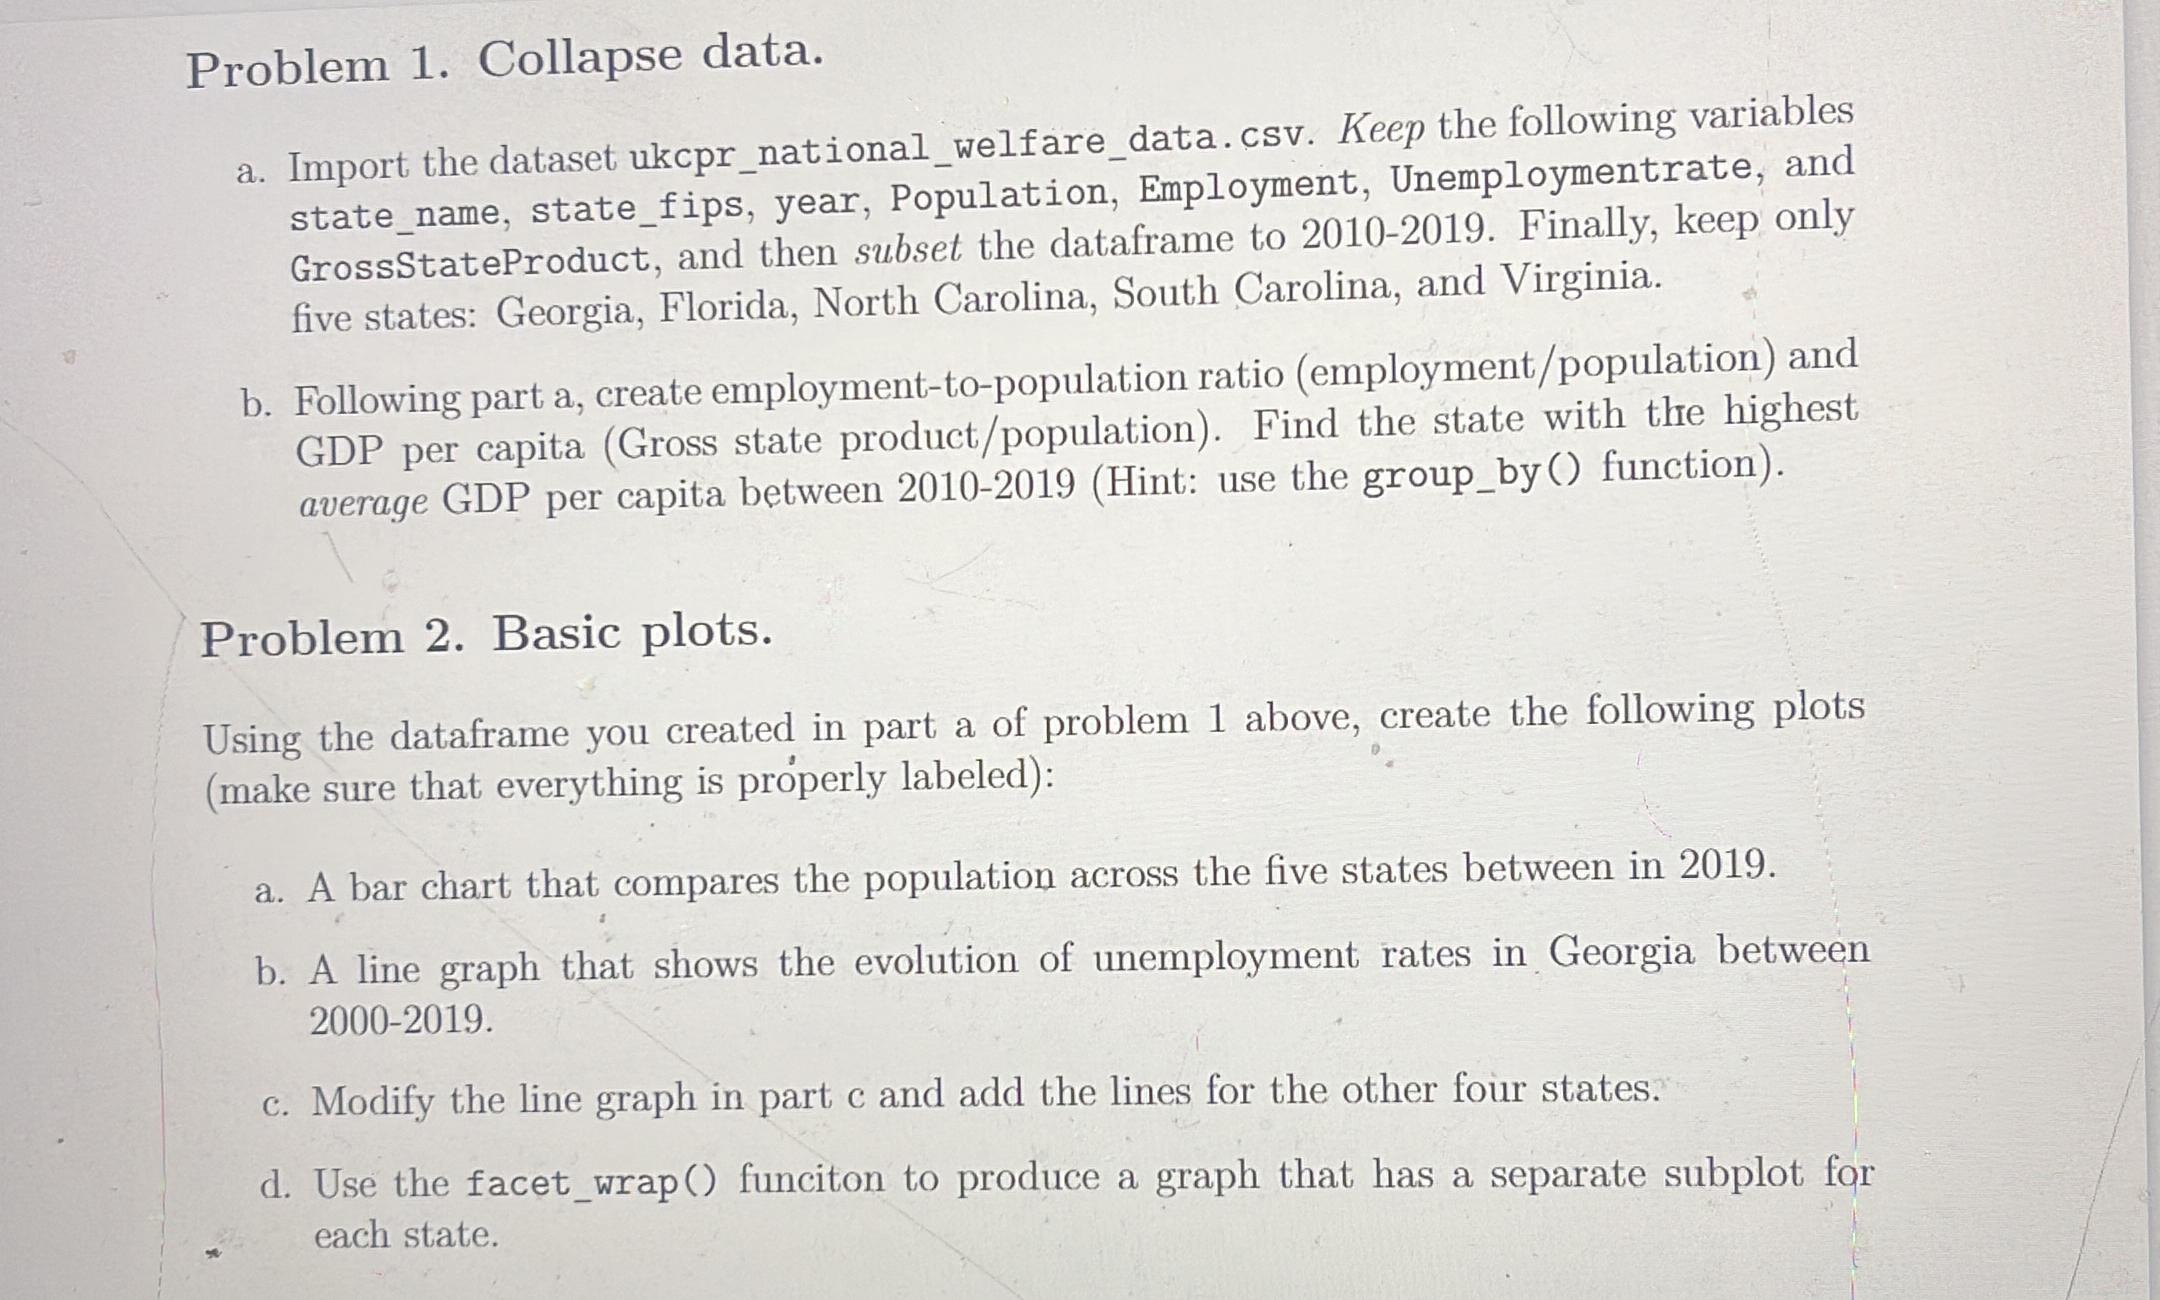
Question: Problem 1 . Collapse data. a . Import the dataset ukcpr _ national _ welfare _ data.csv . Keep the following variables state _ name,
Problem Collapse data.
a Import the dataset ukcprnationalwelfaredata.csv Keep the following variables statename, statefips, year, Population, Employment, Unemploymentrate, and GrossStateProduct, and then subset the dataframe to Finally, keep only five states: Georgia, Florida, North Carolina, South Carolina, and Virginia.
b Following part a create employmenttopopulation ratio employmentpopulation and GDP per capita Gross state productpopulation Find the state with the highest average GDP per capita between Hint: use the groupby function
Problem Basic plots.
Using the dataframe you created in part a of problem above, create the following plots make sure that everything is properly labeled:
a A bar chart that compares the population across the five states between in
b A line graph that shows the evolution of unemployment rates in Georgia between
c Modify the line graph in part and add the lines for the other four states.
d Use the facetwrap funciton to produce a graph that has a separate subplot for each state.

Step by Step Solution
There are 3 Steps involved in it
1 Expert Approved Answer
Step: 1 Unlock


Question Has Been Solved by an Expert!
Get step-by-step solutions from verified subject matter experts
Step: 2 Unlock
Step: 3 Unlock


