

Answered step by step
Verified Expert Solution
Question
1 Approved Answer
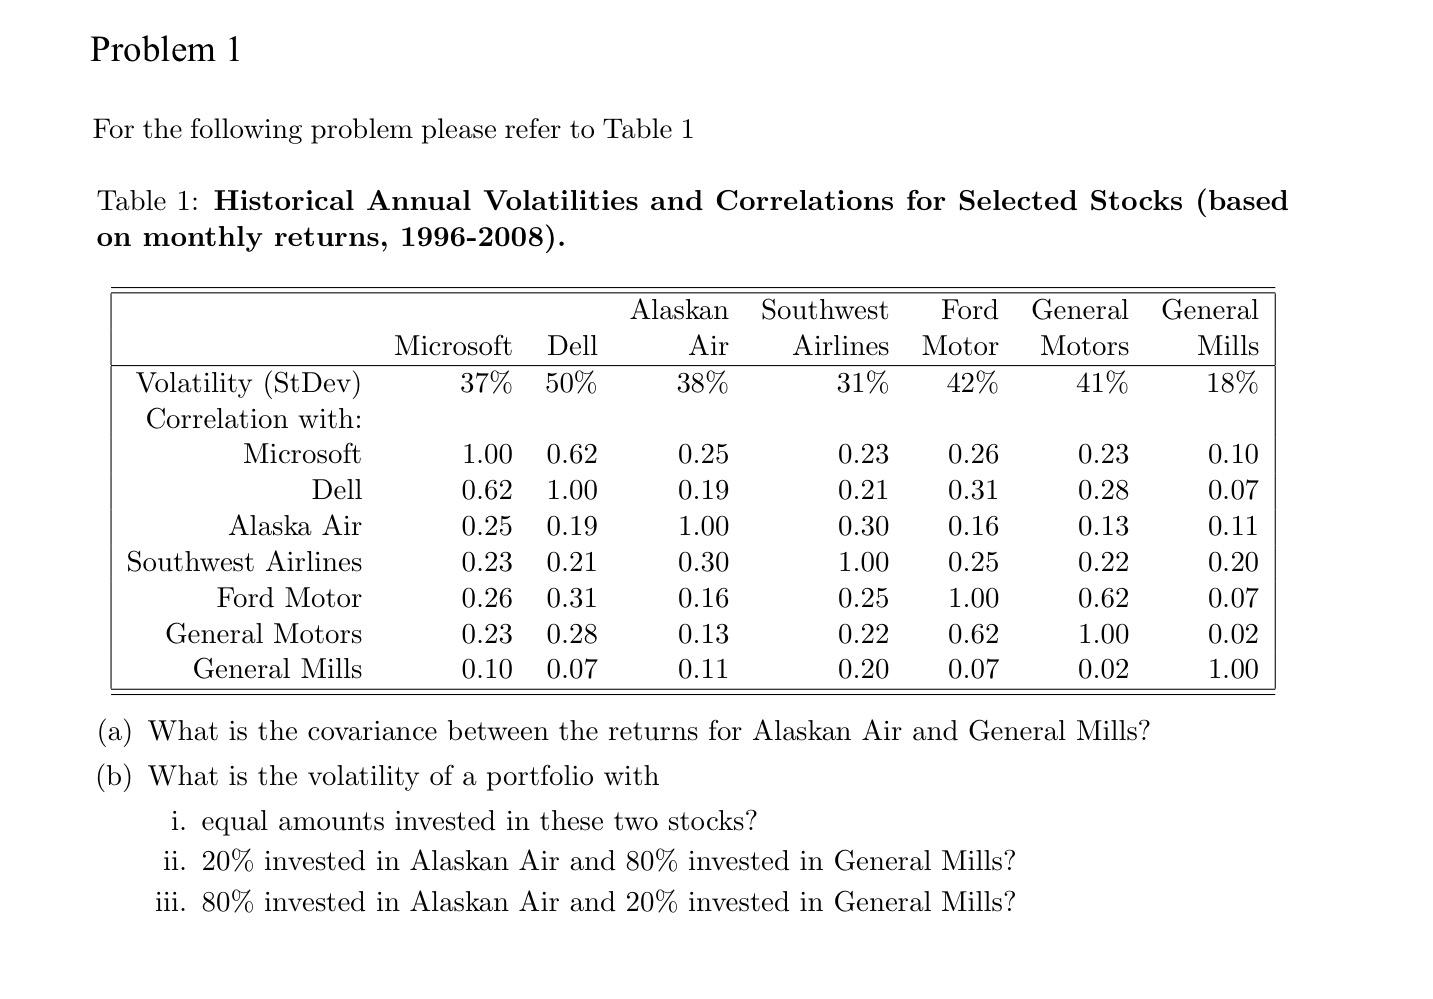
Problem 1 For the following problem please refer to Table 1 Table 1: Historical Annual Volatilities and Correlations for Selected Stocks (based on monthly returns,
Step by Step Solution
There are 3 Steps involved in it
Step: 1

Get Instant Access to Expert-Tailored Solutions
See step-by-step solutions with expert insights and AI powered tools for academic success
Step: 2

Step: 3
Ace Your Homework with AI
Get the answers you need in no time with our AI-driven, step-by-step assistance
Get Started
Practical Financial Management
Authors: William R. Lasher
7th edition
128560721X, 9781133593669, 1133593682, 9781285607214, 978-1133593683