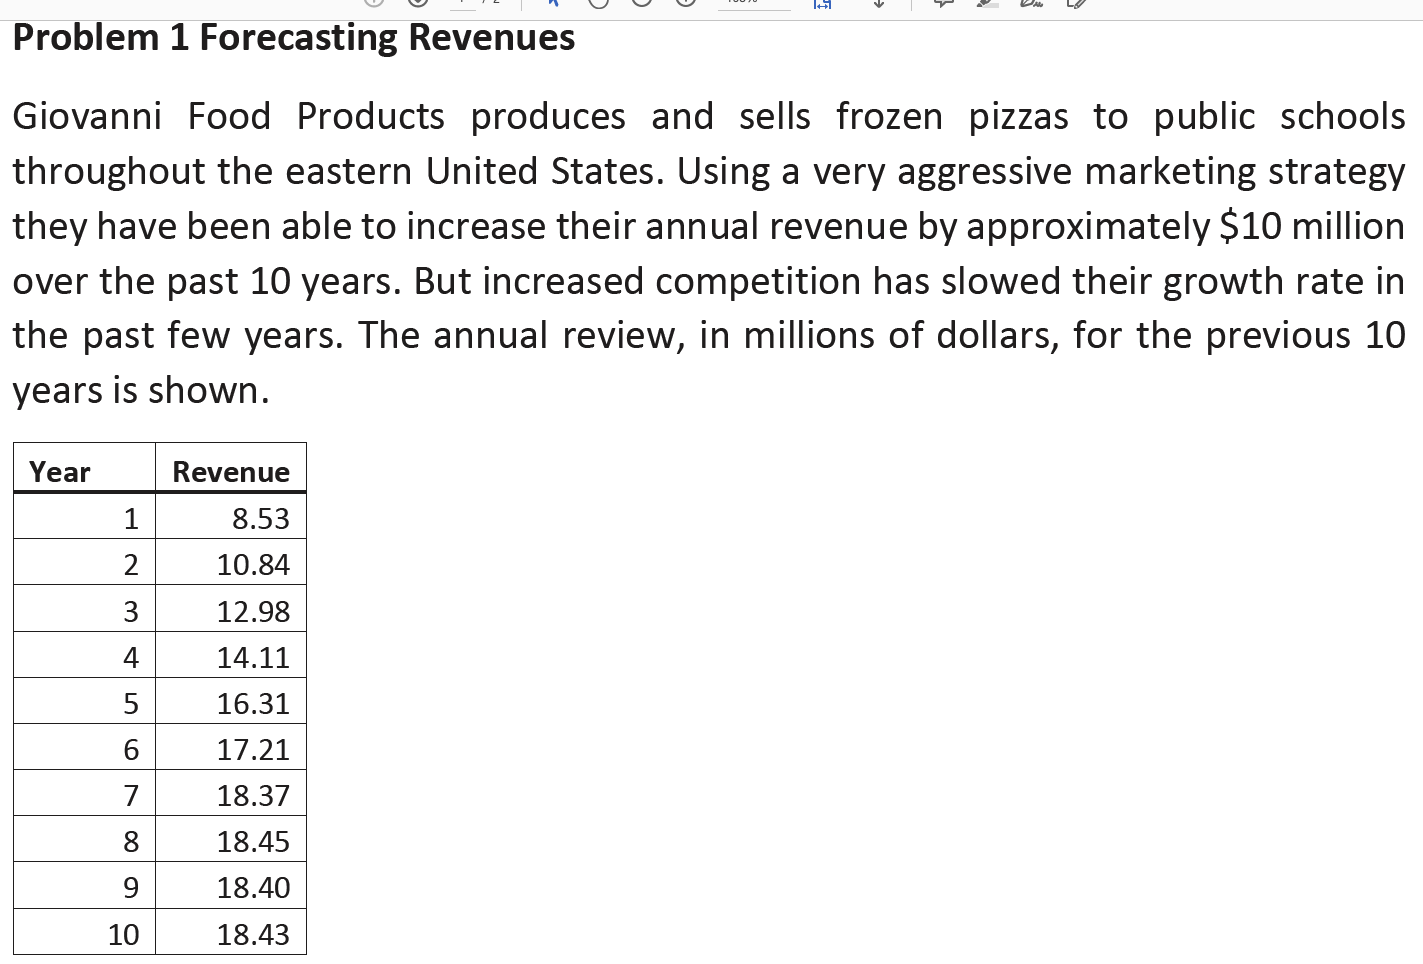
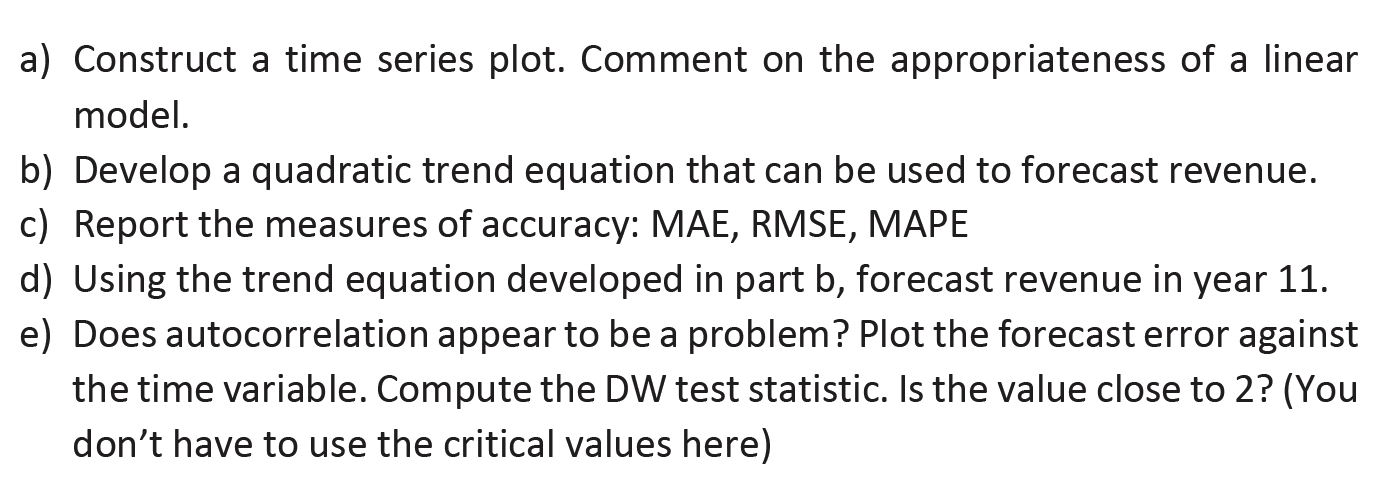
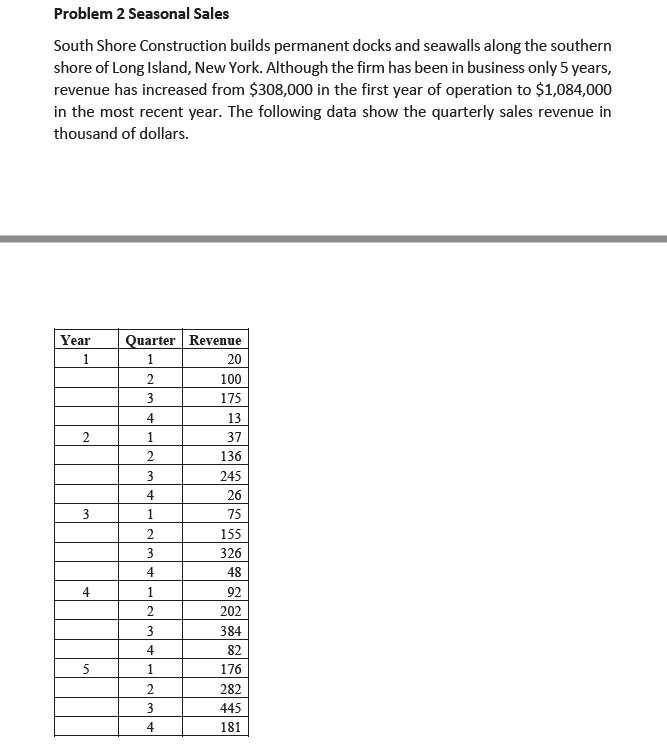
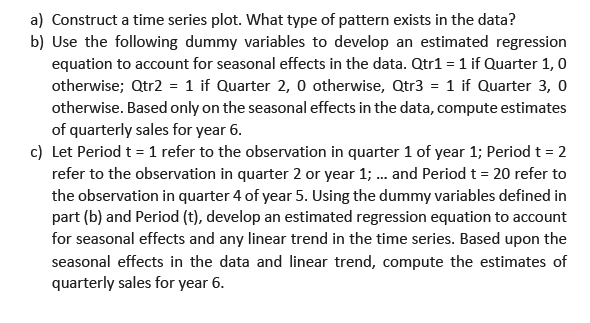
Problem 1 Forecasting Revenues Giovanni Food Products produces and sells frozen pizzas to public schools throughout the eastern United States. Using a very aggressive marketing strategy they have been able to increase their annual revenue by approximately $10 million over the past 10 years. But increased competition has slowed their growth rate in the past few years. The annual review, in millions of dollars, for the previous 10 years is shown. Year Revenue 8.53 N 10.84 3 12.98 4 14.11 5 16.31 6 17.21 7 18.37 8 18.45 9 18.40 10 18.43Construct a time series plot. Comment on the appropriateness of a linear model. Develop a quadratic trend equation that can be used to forecast revenue. Report the measures of accuracy: MAE, RMSE, MAPE Using the trend equation developed in part b, forecast revenue in year 11. Does autocorrelation appear to be a problem? Plot the forecast error against the time variable. Compute the DW test statistic. Is the value close to 2? (You don't have to use the critical values here) Problem 2 Seasonal Sales South Shore Construction builds permanent docks and seawalls along the southern shore of Long Island, New York. Although the firm has been in business only 5 years, revenue has increased from $308,000 in the first year of operation to $1,084,000 in the most recent year. The following data show the quarterly sales revenue in thousand of dollars. Year Quarter Revenue 1 1 20 2 100 3 175 13 2 37 2 136 245 4 26 3 75 2 155 3 326 4 48 4 92 W N- 202 384 4 32 5 176 2 282 3 445 181a) Construct a time series plot. What type of pattern exists in the data? b) Use the following dummy variables to develop an estimated regression equation to account for seasonal effects in the data. Qtr1 = 1 if Quarter 1, 0 otherwise; Qtr2 = 1 if Quarter 2, 0 otherwise, Qtr3 = 1 if Quarter 3, 0 otherwise. Based only on the seasonal effects in the data, compute estimates of quarterly sales for year 6. c) Let Period t = 1 refer to the observation in quarter 1 of year 1; Period t = 2 refer to the observation in quarter 2 or year 1; ... and Period t = 20 refer to the observation in quarter 4 of year 5. Using the dummy variables defined in part (b) and Period (t), develop an estimated regression equation to account for seasonal effects and any linear trend in the time series. Based upon the seasonal effects in the data and linear trend, compute the estimates of quarterly sales for year 6
