Question: Problem 1 In the previous problem set for this course, you applied Benford's Law to purchases of liquor by merchants in Iowa. (This is


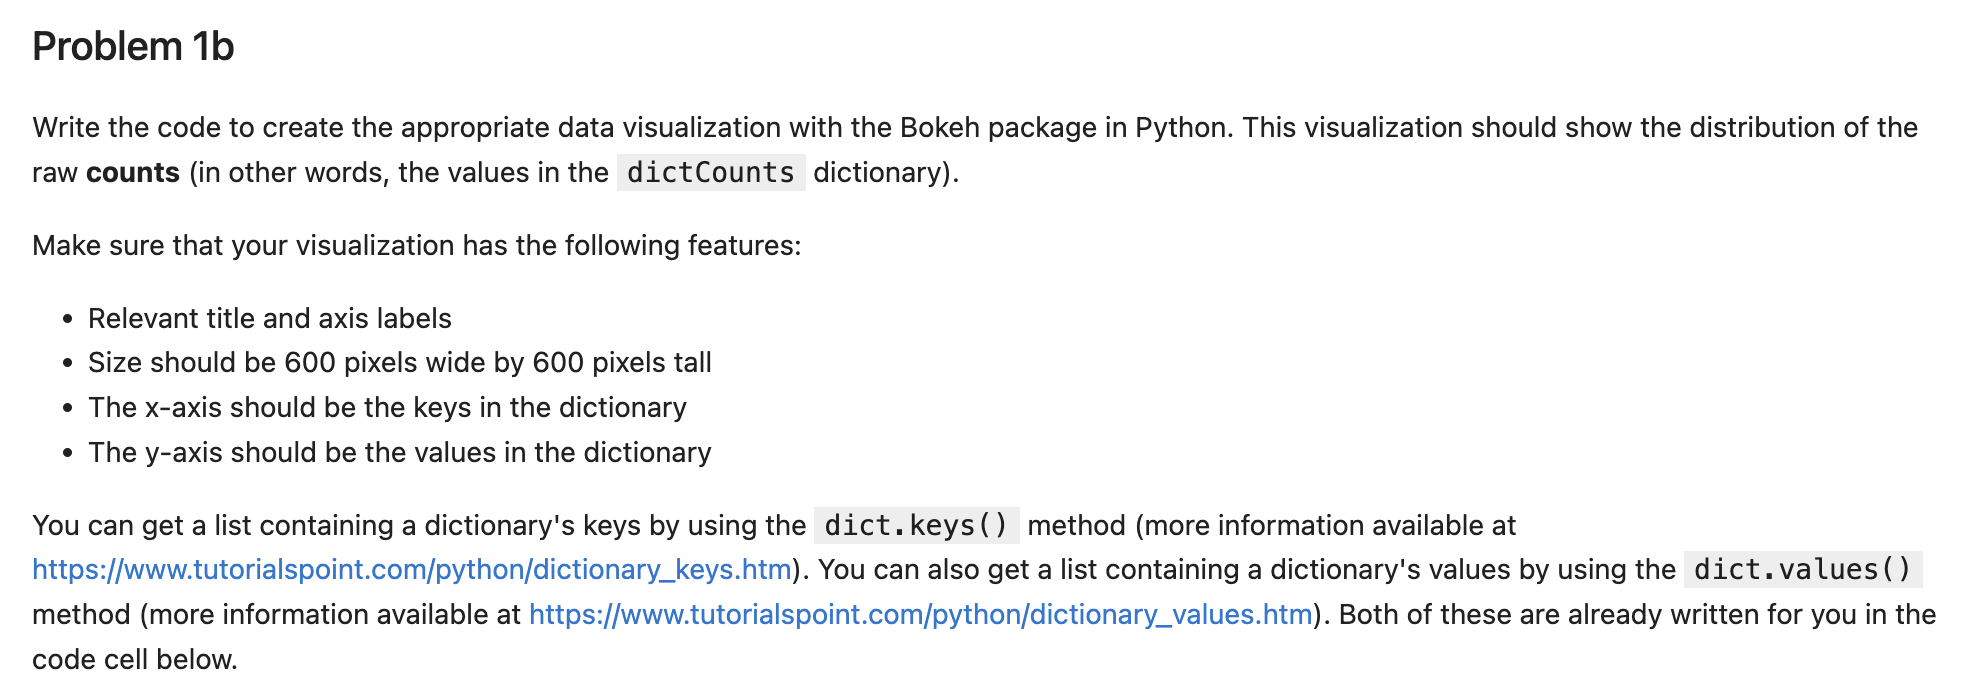
Problem 1 In the previous problem set for this course, you applied Benford's Law to purchases of liquor by merchants in Iowa. (This is a common test for fraud.) In this exercise, you will create visualizations that show the distribution of the first digit in each sales amount. Below is some code to import the data and recreate the two dictionaries that you created previously: dictCounts, a dictionary where the keys are the digits 1-9, and the values are the number of observations where the respective key is the first digit. dict Percents, a dictionary where the keys are the digits 1-9, and the values are the percent of times where the respective key is the first digit. Problem 1b Write the code to create the appropriate data visualization with the Bokeh package in Python. This visualization should show the distribution of the raw counts (in other words, the values in the dictCounts dictionary). Make sure that your visualization has the following features: Relevant title and axis labels Size should be 600 pixels wide by 600 pixels tall The x-axis should be the keys in the dictionary The y-axis should be the values in the dictionary You can get a list containing a dictionary's keys by using the dict.keys() method (more information available at https://www.tutorialspoint.com/python/dictionary_keys.htm). You can also get a list containing a dictionary's values by using the dict.values() method (more information available at https://www.tutorialspoint.com/python/dictionary_values.htm). Both of these are already written for you in the code cell below. Problem 1c Write the code to create the appropriate data visualization with the Bokeh package in Python. This visualization should show the distribution of the percents (in other words, the values in the dictPercents dictionary). Make sure that your visualization has the following features: Relevant title and axis labels Size should be 600 pixels wide by 600 pixels tall The x-axis should be the keys in the dictionary The y-axis should be the values in the dictionary As with problem 1b, we retrieved the digits and percentages as lists for you. Problem 1d The shapes of the graphs in problems 1b and 1c are identical. Why? Is it a coincidence? Enter your answer here.
Step by Step Solution
3.42 Rating (158 Votes )
There are 3 Steps involved in it
Here is the code to import the data and recreate the two dictionaries import pandas as pd import mat... View full answer

Get step-by-step solutions from verified subject matter experts


