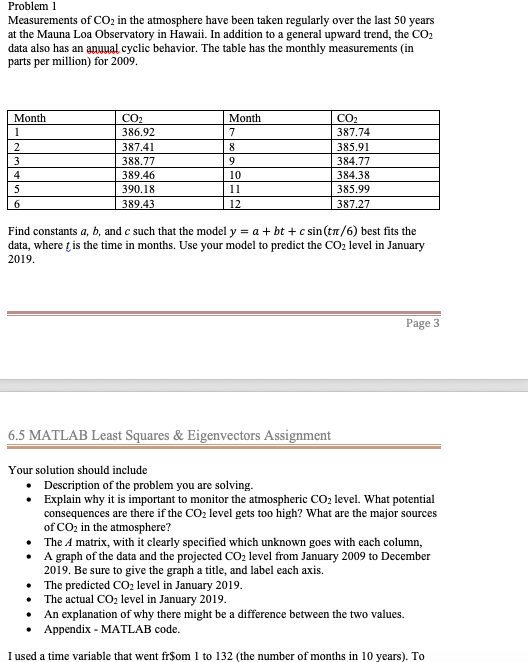
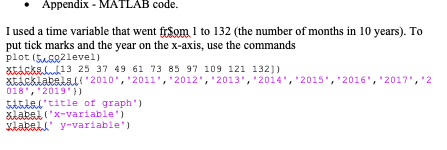
Problem 1 Measurements of CO2 in the atmosphere have been taken regularly over the last 50 years at the Mauna Loa Observatory in Hawaii. In addition to a general upward trend, the CO2 data also has an anuual cyclic behavior. The table has the monthly measurements (in parts per million) for 2009 Month CO2 386.92 387.41 388.77 389.46 390.18 Month CO2 387.74 385.91 384.77 384.38 385.99 10 Find constants a, b, and c such that the model y-a t bt c sin(t/6) best fits the data, where t is the time in months. Use your model to predict the CO2 level in January 2019 Page 3 6.5 MATLAB Least Squares &Eigenvectors Assignment Your solution should include .Description of the problem you are solving .Explain why it is important to monitor the atmospheric CO2 level. What potential consequences are there if the CO2 level gets too high? What are the major sources of CO2 in the atmosphere? The A matrix, with it clearly specified which unknown goes with each column. .A graph of the data and the projected CO2 level from January 2009 to December 2019. Be sure to give the graph a title, and label each axis. . The predicted CO2 level in January 2019 . The actual CO2 level in January 2019 .An explanation of why there might be a difference between the two values. Appendix - MATLAB code I used a time variable that went fr$om 1 to 132 (the number of months in 10 years). To Appendix- MATLAB code. I used a time variable that went frSom 1 to 132 (the number of months in 10 years). To put tick marks and the year on the x-axis, use the commands plot (suS021evel) xtdcks.l13 25 37 49 61 73 85 97 109 121 132]) tdklabelsl 2010, 2011,2012,2013",2014,2015 ,2016", 2017",'2 018, "2019") isiel'title or graph stabal('x-variable') xiabsl y-variable') Problem 1 Measurements of CO2 in the atmosphere have been taken regularly over the last 50 years at the Mauna Loa Observatory in Hawaii. In addition to a general upward trend, the CO2 data also has an anuual cyclic behavior. The table has the monthly measurements (in parts per million) for 2009 Month CO2 386.92 387.41 388.77 389.46 390.18 Month CO2 387.74 385.91 384.77 384.38 385.99 10 Find constants a, b, and c such that the model y-a t bt c sin(t/6) best fits the data, where t is the time in months. Use your model to predict the CO2 level in January 2019 Page 3 6.5 MATLAB Least Squares &Eigenvectors Assignment Your solution should include .Description of the problem you are solving .Explain why it is important to monitor the atmospheric CO2 level. What potential consequences are there if the CO2 level gets too high? What are the major sources of CO2 in the atmosphere? The A matrix, with it clearly specified which unknown goes with each column. .A graph of the data and the projected CO2 level from January 2009 to December 2019. Be sure to give the graph a title, and label each axis. . The predicted CO2 level in January 2019 . The actual CO2 level in January 2019 .An explanation of why there might be a difference between the two values. Appendix - MATLAB code I used a time variable that went fr$om 1 to 132 (the number of months in 10 years). To Appendix- MATLAB code. I used a time variable that went frSom 1 to 132 (the number of months in 10 years). To put tick marks and the year on the x-axis, use the commands plot (suS021evel) xtdcks.l13 25 37 49 61 73 85 97 109 121 132]) tdklabelsl 2010, 2011,2012,2013",2014,2015 ,2016", 2017",'2 018, "2019") isiel'title or graph stabal('x-variable') xiabsl y-variable')