

Answered step by step
Verified Expert Solution
Question
1 Approved Answer
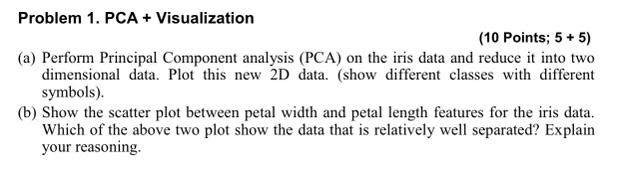
Problem 1 . PCA + Visualization ( 1 0 Points; 5 + 5 ) ( a ) Perform Principal Component analysis ( PCA ) on
Problem PCA Visualization
Points;
a Perform Principal Component analysis PCA on the iris data and reduce it into two dimensional data. Plot this new D data. show different classes with different symbols
b Show the scatter plot between petal width and petal length features for the iris data. Which of the above two plot show the data that is relatively well separated? Explain your reasoning.
Please solve in Rstudio
Step by Step Solution
There are 3 Steps involved in it
Step: 1

Get Instant Access to Expert-Tailored Solutions
See step-by-step solutions with expert insights and AI powered tools for academic success
Step: 2

Step: 3
Ace Your Homework with AI
Get the answers you need in no time with our AI-driven, step-by-step assistance
Get Started
Oracle 10g Database Administrator Implementation And Administration
Authors: Gavin Powell, Carol McCullough Dieter
2nd Edition
1418836656, 9781418836658