Answered step by step
Verified Expert Solution
Link Copied!

Question

1 Approved Answer

Problem #1 Ratios Lulu, Inc. Balance Sheets E nding Balances per years 2019 2020 Cash 100,000 120,000 Supplies 4 0 ,000 35,000 AR 40,000 3

Problem #1 Ratios

Lulu, Inc.

Balance Sheets

Ending Balances per years

2019

2020

Cash

100,000

120,000

Supplies

40,000

35,000

AR

40,000

35,000

Inventory

50,000

60,000

Equipment

150,000

140,000

Total

380,000

390,000

Liabilities

AP

30,000

33,000

Salaries Payable

20,000

22,000

NP

180,000

180,000

Total

230,000

235,000

Equity

Common stock

75,000

75,000

PIC Common

40,000

40,000

Retained Earnings

35,000

40,000

Total

150,000

155,000

Total Liabilities &Equity

380,000

390,000

LuLu. Inc.

Income Statement

For the Year Ended 2020

Sales

1,000,000

COGS

450,000

Gross Margin

550,000

Operating Expense

Administrative

100,000

Selling

60,000

Total

160,000

EBIT

390,000

Interest

10,000

EBT

380,000

Taxes

50% rate

190,000

Operating Income

190,000

Notes:

There are 120,000 shares of Common Stock. 400,000 shares are authorized and 120,000 are issued and outstanding. There is no Treasury Stock or Preferred Stock.
Market price per share is $35.
Dividends of $10,000 were issued.
Assume that Cash Flows from Operating Activities is $210,000.
Capital Expenditures for the year are $65,000.

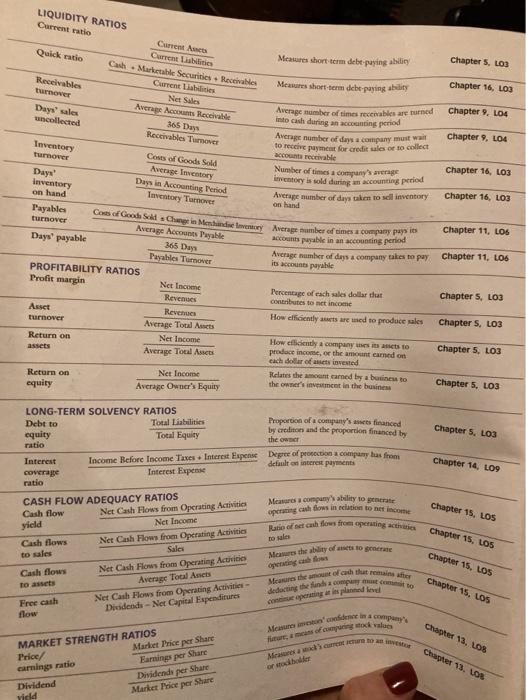
Required: Compute the ratios for 2020. Compute all ratios as are listed in the front cover page of your textbook.

Required: Highlight, underline, circle, or show you answers that I can easily identify them. Also, show all work to arrive at your answers. Failure to provide work = zero.

image text in transcribed
Measures short term debe paying alley LIQUIDITY RATIOS Current ratio Current Ames Current Liabilities Quick ratio Cash - Marketable Securities Receivables Current Liabilities Receivables Net Sales tumover Average Accounts Receivable Days' sales 365 Days wcollected Receivables Tumove Chapter 5, LOS Mesures short-term debe paying ability Chapter 16, LOS Chapter 9, L04 Chapter 9, L04 Inventory turnover Chapter 16, LO3 Chapter 16, LOS Chapte 11, LOS Average number of times recewables are turned into cash during an accounting period Average number of days a company must all to receive payment for credit les or to collect accounts receive Cons of Goods Sold Average Inventory Number of times a company's wverage Daya Inventory Days in Accounting Teriod inventory is sold during an accounting period on hand Inventory Turnover Average number of days taken to sell inventory on hand Payables Com of Good Sid. Change in Menbildid Inventory Average amber of times a company pod turnover Average Accounts Payable Days' payable accounts payable in an accounting period 365 Days Average number of days a company takes to pay Payables Turnover is accounts payable PROFITABILITY RATIOS Profit margin Net Income Percentage of each sales dollar that Revenues contributes to net income Asset Revenues How eficiently sets are used to produce sales turnover Average Total Assets Return on Net Income How efficiently a company is acts to produce inconse, or the amount earned on assets Average Toual Acts cach dollar of invested Net Income Relates the amount carned by a business to Return on the owner's investment in the business equity Average Owner's Equity Chapter 11, LOS Chapter 5, LO3 Chapter S, LO3 Chapter 5, LOS Chapter 5, LOS Chapter 5, LOS ratio LONG-TERM SOLVENCY RATIOS Debt to Total Liabilities Proportion of a company's financed equity by credit and the proportion financed by Total Equity the owner Interest Income Before Income Taxes. Interest Expense Degree of peorection company has from default o interese payments coverage Interest Expense ratio Menards company's ability to generate Cashows in relation to come Chapter 14, LOS Chapter 15, LOS Rochows reporting acts Chapter 15, LOS to a CASH FLOW ADEQUACY RATIOS Cash flow Net Cash Flows from Operating Activities yield Net Income Cash flows Ner Cash Hows from Operating Activities to sales Sales Cash flows Net Cash Flows from Operating Activities to assets Average Tocal Aucts Free cash Net Cash Flows from Operating Activities flow Dividende - Net Capital Expenditures Measure the ability of Chapter 15, LOS ging for Marutha thut roh deducing the ha comptato Chapter 15, LOS coperating at its planned Maps Two cock value Chapter 13.08 Mercut Chapter 13. LOR or odbold MARKET STRENGTH RATIOS Price Market Price per Share cang ratio Earnings per Share Dividend Dividende per Share vild Market Price per Share

Step by Step Solution

There are 3 Steps involved in it

Step: 1

blur-text-image

Get Instant Access to Expert-Tailored Solutions

See step-by-step solutions with expert insights and AI powered tools for academic success

Step: 2

blur-text-image

Step: 3

blur-text-image

Ace Your Homework with AI

Get the answers you need in no time with our AI-driven, step-by-step assistance

Get Started

Recommended Textbook for

Market Contact Audit

Authors: Gerardus Blokdyk

2nd Edition

0655179771, 978-0655179771

More Books

Students also viewed these Accounting questions