Answered step by step
Verified Expert Solution
Question
1 Approved Answer
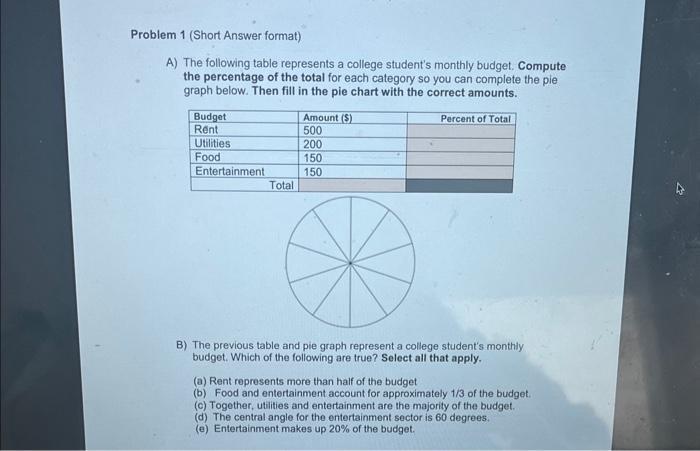
Problem 1 (Short Answer format) A) The following table represents a college student's monthly budget. Compute the percentage of the total for each category

Problem 1 (Short Answer format) A) The following table represents a college student's monthly budget. Compute the percentage of the total for each category so you can complete the pie graph below. Then fill in the pie chart with the correct amounts. Budget Rent Amount ($) 500 Utilities: 200 Food 150 Entertainment 150 Total Percent of Total B) The previous table and pie graph represent a college student's monthly budget. Which of the following are true? Select all that apply. (a) Rent represents more than half of the budget (b) Food and entertainment account for approximately 1/3 of the budget. (c) Together, utilities and entertainment are the majority of the budget. (d) The central angle for the entertainment sector is 60 degrees. (e) Entertainment makes up 20% of the budget.
Step by Step Solution
There are 3 Steps involved in it
Step: 1
First we need to compute the percentage of the total for each category Calculating Percentages 1 Tot...
Get Instant Access to Expert-Tailored Solutions
See step-by-step solutions with expert insights and AI powered tools for academic success
Step: 2

Step: 3

Ace Your Homework with AI
Get the answers you need in no time with our AI-driven, step-by-step assistance
Get Started


