

Question
Problem 1. Simple Moving Average Write MovingAverage3.java, a program that reads stock prices, computes the 3-day simple moving average of the close prices, plots the
Problem 1. Simple Moving Average Write MovingAverage3.java, a program that reads stock prices, computes the 3-day simple moving average of the close prices, plots the prices and moving average, and prints the prices and moving average to standard out. Your program must handle all inputs that conform to the input specification. We will not test non-conforming inputs.
Computing the 3-day Simple Moving Average In finance, a moving average is a very popular stock price analysis indicator. It provides a smooth trend line, removing the distractions of higher frequency price fluctuations. In this problem, you will compute the simple moving average of the closing stock price. The simple moving average on day i is the average of the three most recent close prices, including the close price on day i. You can compute the average for day i by summing the close price for days i, i 1, and i 2 and dividing by 3. Do not compute the moving average for i = 0 and i = 1.
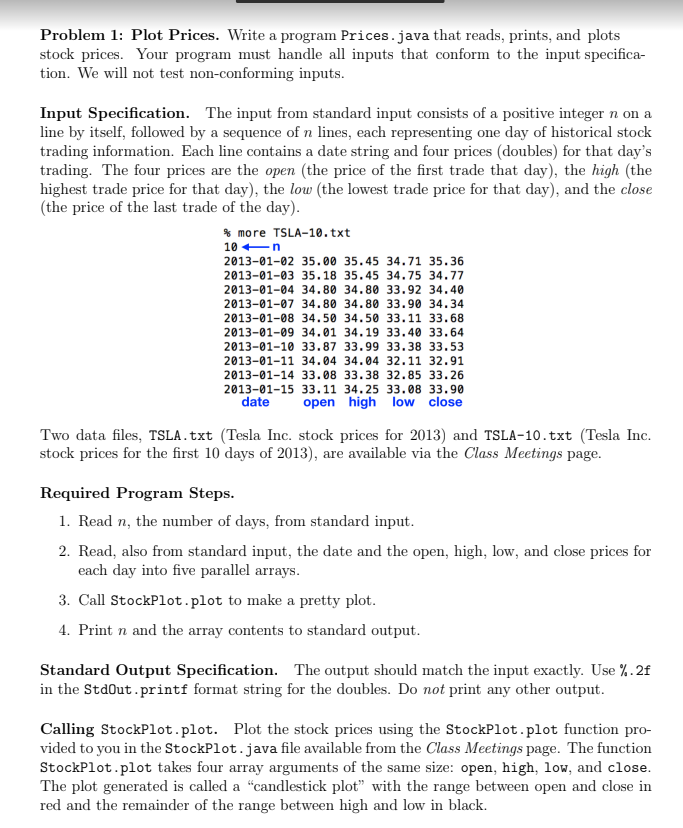
Input specification. The input is the same as part 1. The input will have at least three days of trading history.
Standard output specification. The output should match the input exactly except with the addition of a new column containing the 3-day simple moving average starting on the 3rd day. (The 3-day moving average has no meaning on the first two days.) Do not print any other output to standard output.
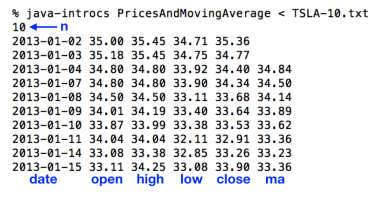
Plotting. The plotting will be performed by StockPlot.plot, the same function used in Problem 1. To plot the moving average, pass six arguments instead of four. These arguments are open, high, low, close, ma (the moving average), and days. The first five arguments passed must be double arrays of the same size. The last argument, days, an integer, expresses the moving average number of days (3 in this case). StockPlot.plot will ignore the values in ma for days less than days (index 0 and 1 in this case).
This is part 1
Step by Step Solution
There are 3 Steps involved in it
Step: 1

Get Instant Access to Expert-Tailored Solutions
See step-by-step solutions with expert insights and AI powered tools for academic success
Step: 2

Step: 3
Ace Your Homework with AI
Get the answers you need in no time with our AI-driven, step-by-step assistance
Get Started
Mastering MongoDB 4 X Expert Techniques To Run High Volume And Fault Tolerant Database Solutions Using MongoDB 4 X
Authors: Alex Giamas
2nd Edition
1789617871, 978-1789617870