Answered step by step
Verified Expert Solution
Question
1 Approved Answer
Problem 1. Three events are shown on the Venn diagram in the following figure: Reproduce the figure and shade the region that corresponds to each
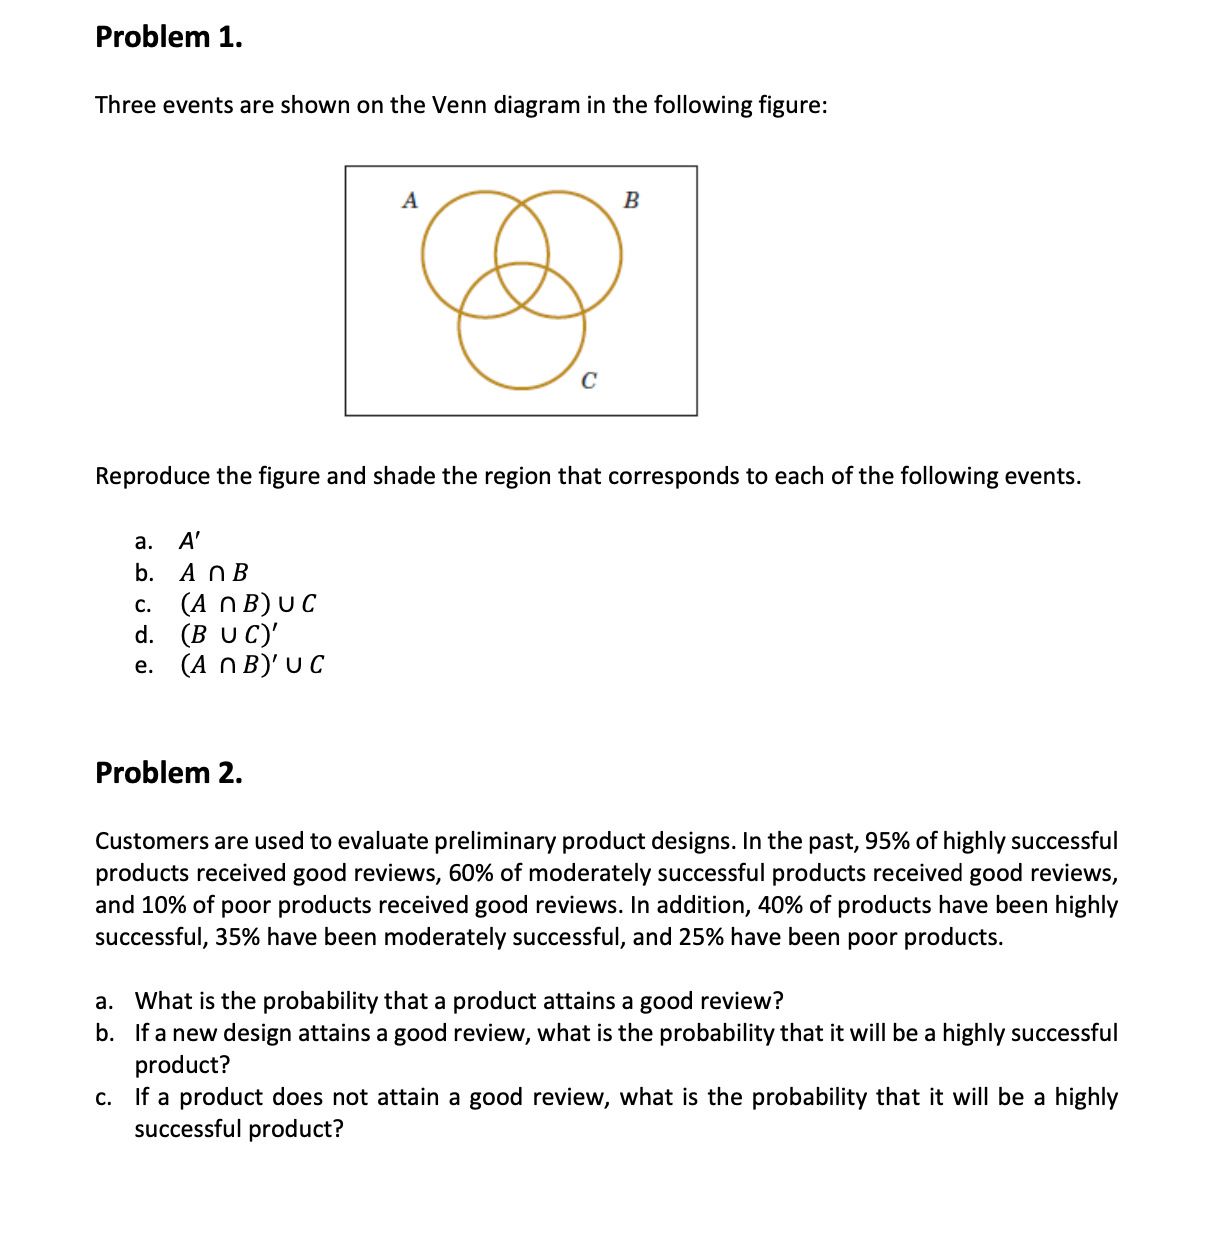
Problem 1. Three events are shown on the Venn diagram in the following figure: Reproduce the figure and shade the region that corresponds to each of the following events. a. A' b. A nB c. (A nB)uc d. (B u C)' e. (A may u c Problem 2. Customers are used to evaluate preliminary product designs. In the past, 95% of highly successful products received good reviews, 60% of moderately successful products received good reviews, and 10% of poor products received good reviews. In addition, 40% of products have been highly successful, 35% have been moderately successful, and 25% have been poor products. 9' What is the probability that a product attains a good review? b. If a new design attains a good review, what is the probability that it will be a highly successful product? c. If a product does not attain a good review, what is the probability that it will be a highly successful product
Step by Step Solution
There are 3 Steps involved in it
Step: 1
Get Instant Access to Expert-Tailored Solutions
See step-by-step solutions with expert insights and AI powered tools for academic success
Step: 2
Step: 3
Ace Your Homework with AI
Get the answers you need in no time with our AI-driven, step-by-step assistance
Get Started