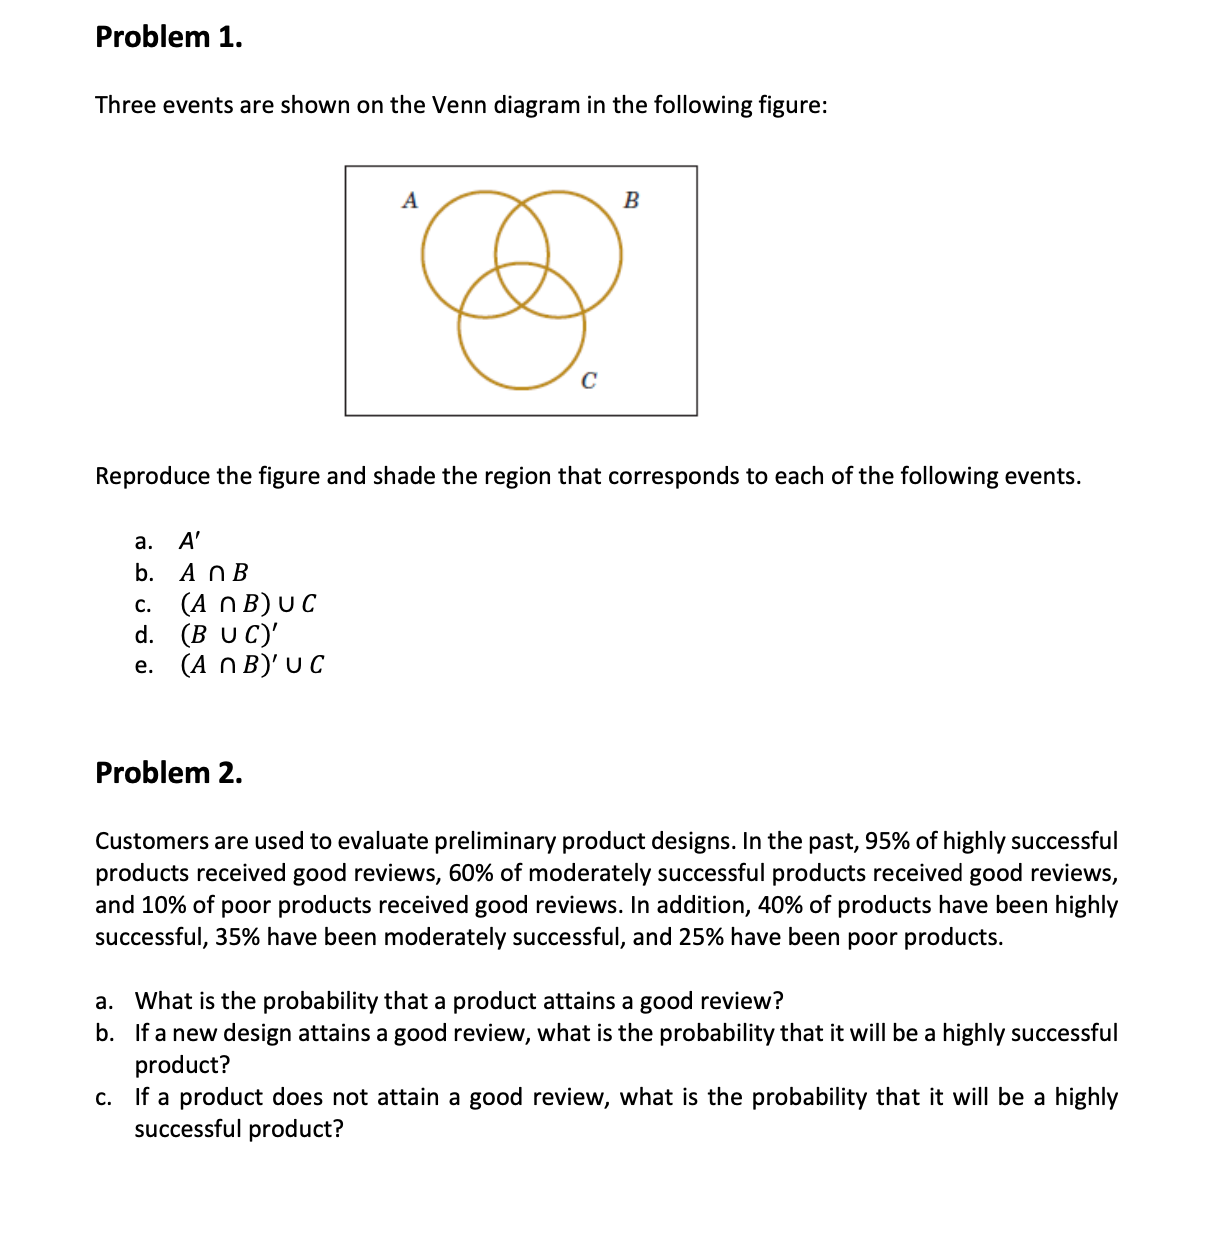
Question: Problem 1. Three events are shown on the Venn diagram in the following figure: Reproduce the figure and shade the region that corresponds to each


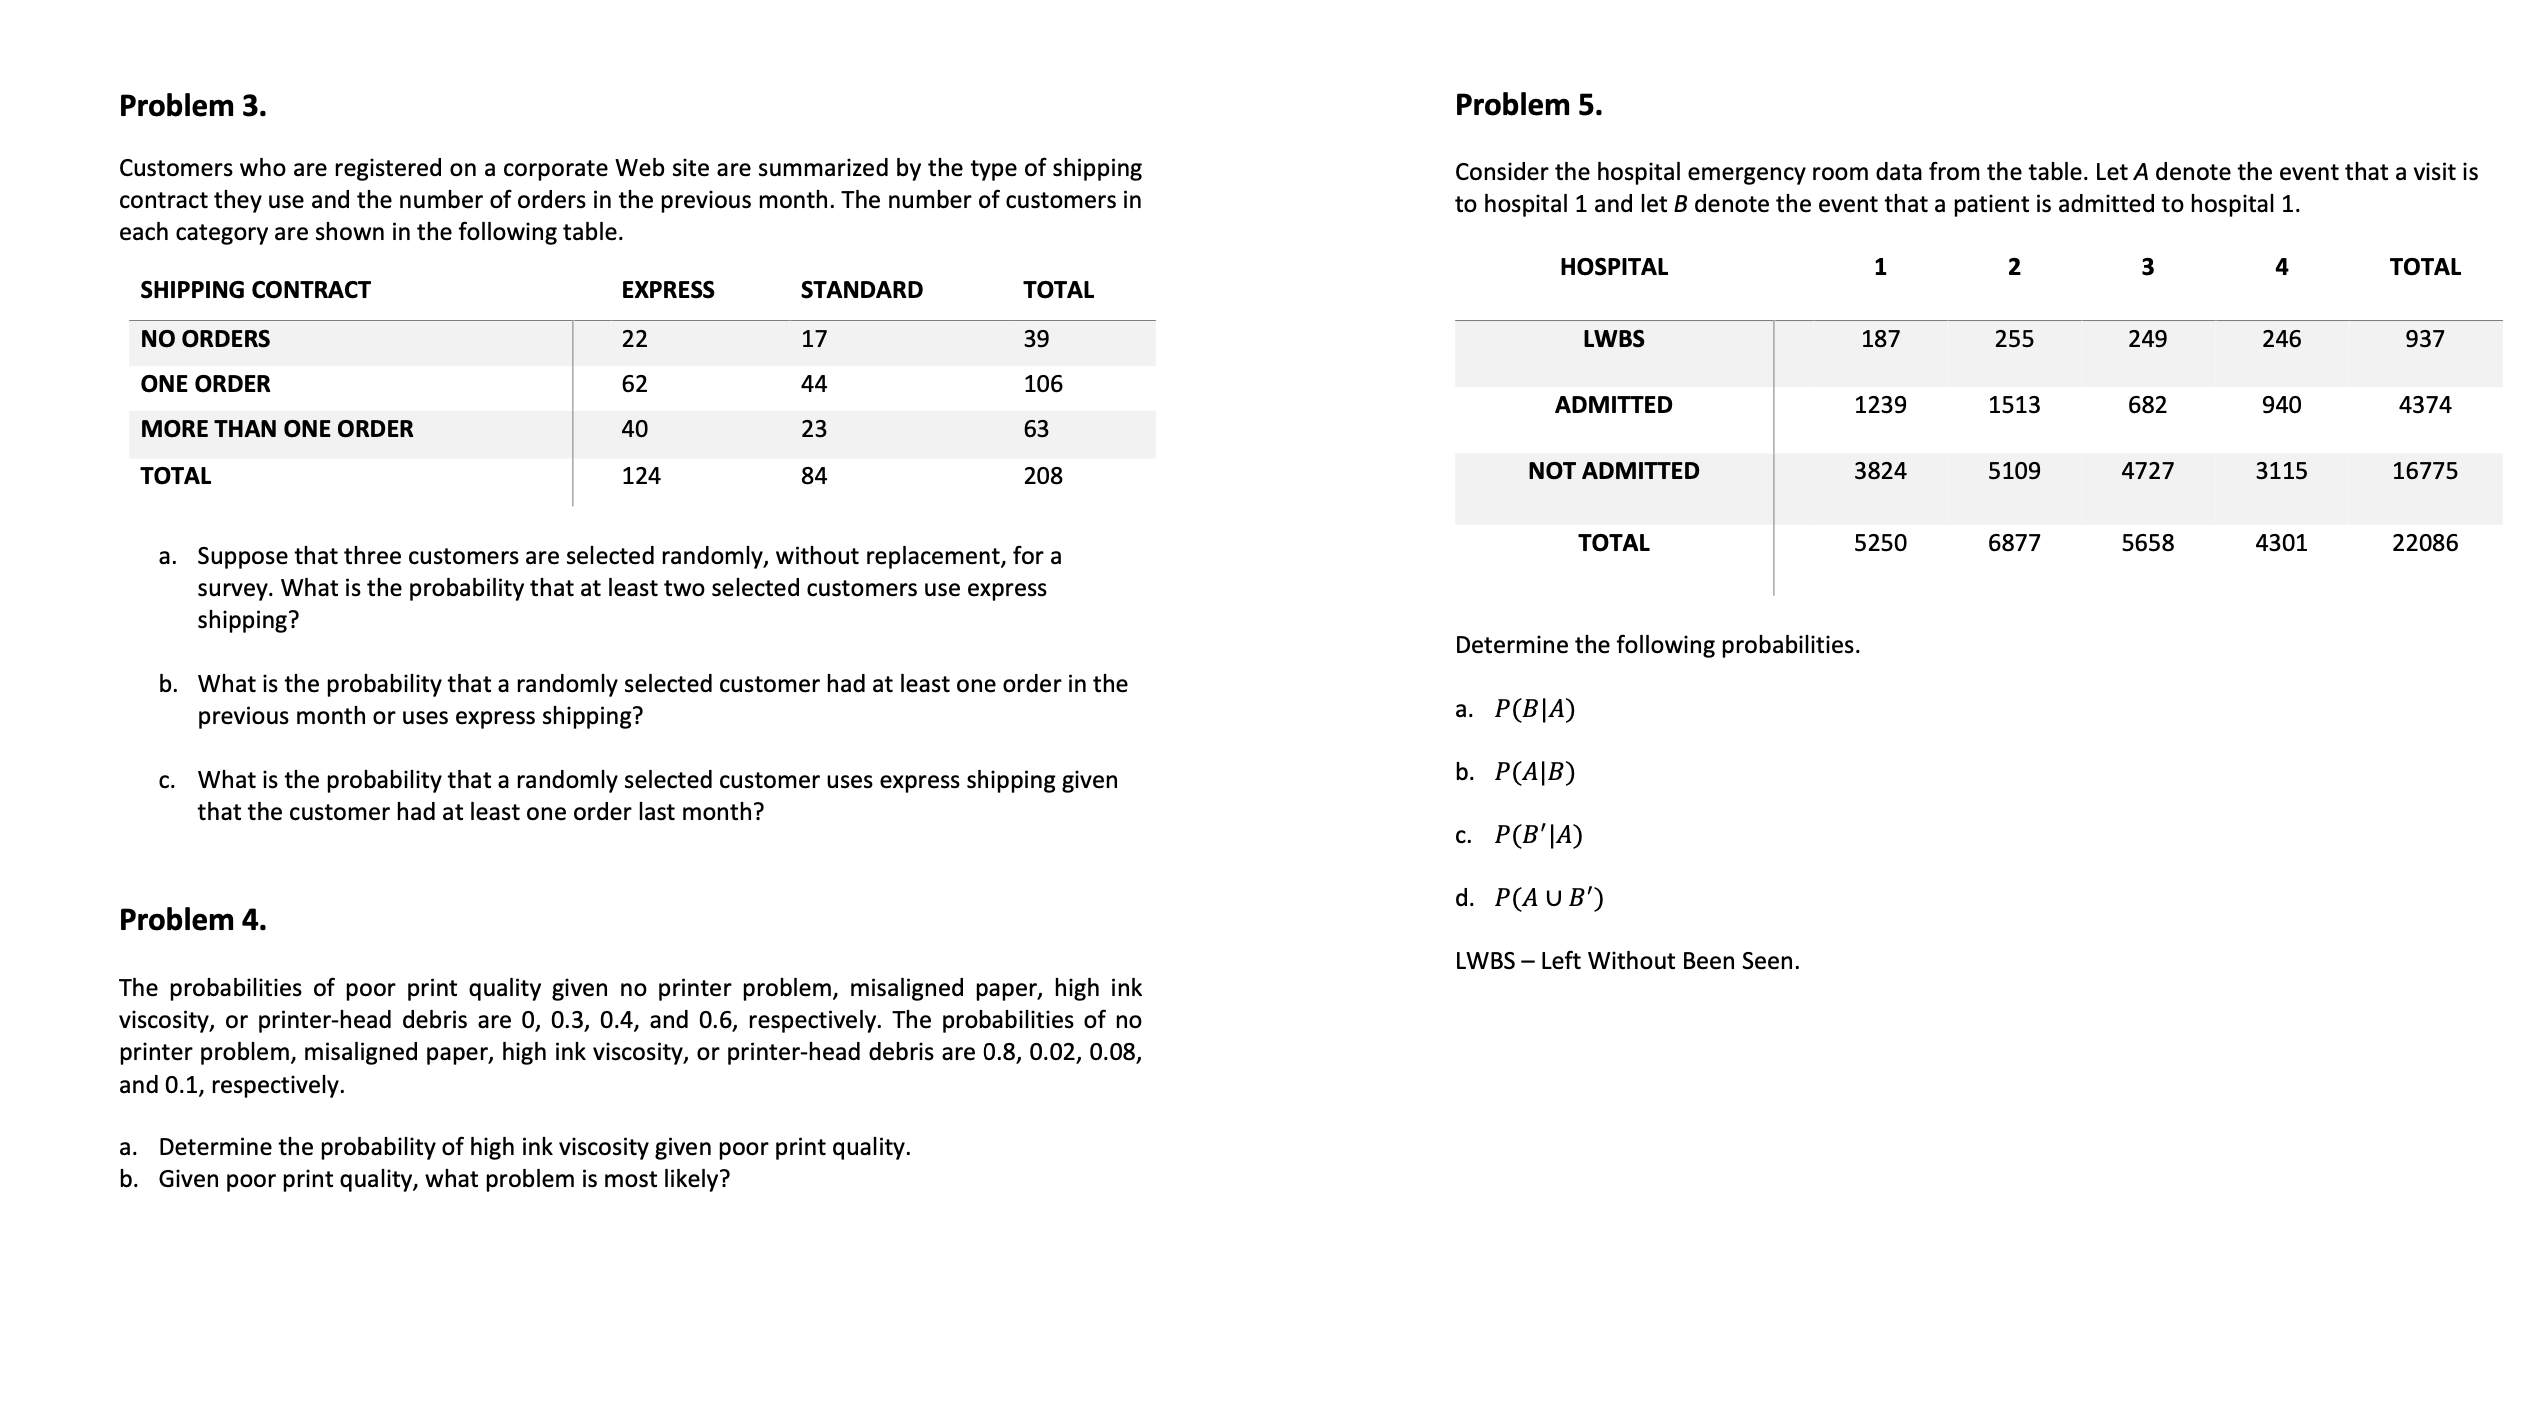
Problem 1. Three events are shown on the Venn diagram in the following figure: Reproduce the figure and shade the region that corresponds to each of the following events. a. A' b. A nB c. (A nB)uc d. (B u C)' e. (A may u c Problem 2. Customers are used to evaluate preliminary product designs. In the past, 95% of highly successful products received good reviews, 60% of moderately successful products received good reviews, and 10% of poor products received good reviews. In addition, 40% of products have been highly successful, 35% have been moderately successful, and 25% have been poor products. 9' What is the probability that a product attains a good review? b. If a new design attains a good review, what is the probability that it will be a highly successful product? c. If a product does not attain a good review, what is the probability that it will be a highly successful product? Problem 3. Customers who are registered on a corporate Web site are summarized by the type of shipping contract they use and the number of orders in the previous month. The number of customers in each category are shown in the following table. SHIPPING CONTRACT EXPRESS STANDARD TOTAL NO ORDERS 22 17 39 ONE ORDER 62 44 106 MORE THAN ONE ORDER 40 23 63 TOTAL 124 84 208 a. Suppose that three customers are selected randomly, without replacement, for a survey. What is the probability that at least two selected customers use express shipping? b. What is the probability that a randomly selected customer had at least one order in the previous month or uses express shipping? c. What is the probability that a randomly selected customer uses express shipping given that the customer had at least one order last month? Problem 4. The probabilities of poor print quality given no printer problem, misaligned paper, high ink viscosity, or printerhead debris are 0, 0.3, 0.4, and 0.6, respectively. The probabilities of no printer problem, misaligned paper, high ink viscosity, or printer-head debris are 0.8, 0.02, 0.08, and 0.1, respectively. a. Determine the probability of high ink viscosity given poor print quality. b. Given poor print quality, what problem is most likely? Problem 5. Consider the hospital emergency room data from the table. LetA denote the event that a visit is to hospital 1 and let 8 denote the event that a patient is admitted to hospital 1. HOSPITAL 1 2 3 4 TOTAL LWBS 187 255 249 246 937 ADMITI'ED 1239 1513 682 940 4374 NOT ADMITI'ED 3824 5109 4727 3115 16775 TOTAL 5250 6877 5658 4301 22086 Determine the following probabilities. a. P(B|A) b. P(A|B) c. P(B'|A) d. P(A u 3') LWBS Left Without Been Seen
Step by Step Solution
There are 3 Steps involved in it

Get step-by-step solutions from verified subject matter experts


