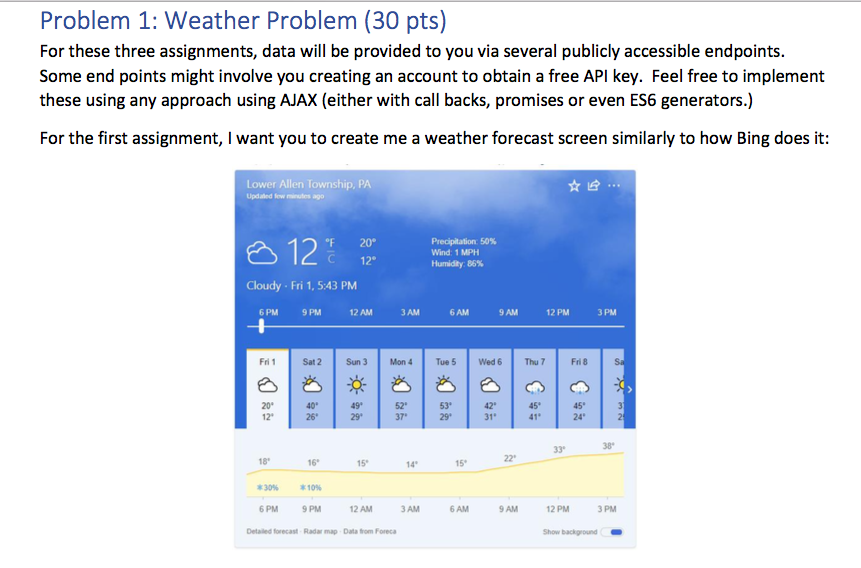
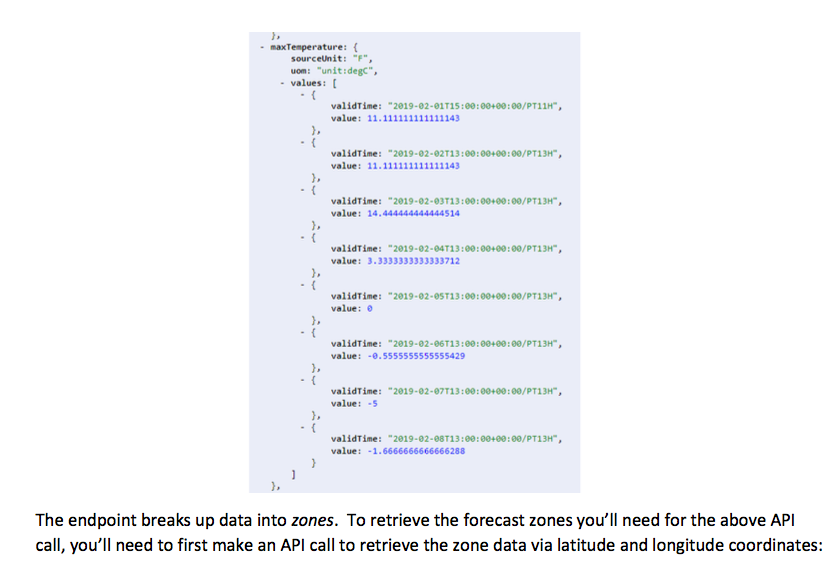
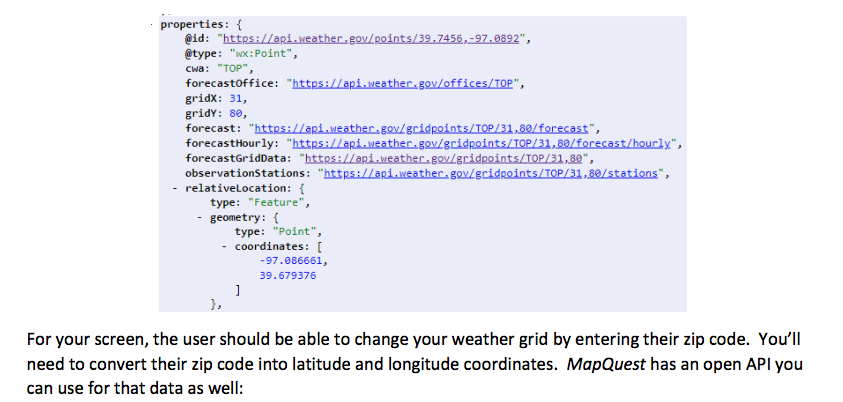
Problem 1: Weather Problem (30 pts) For these three assignments, data will be provided to you via several publicly accessible endpoints. Some end points might involve you creating an account to obtain a free API key. Feel free to implement these using any approach using AJAX (either with call backs, promises or even ES6 generators.) For the first assignment, I want you to create me a weather forecast screen similarly to how Bing does it: Lower Allen Township, PA Updated few minutes ago 12 h 20 12 Precipitation: 50% Wind: 1 MPH Humidity: 86% Cloudy. Fri 1,5:43 PM 6 PM 9 PM 12 AM 3 AM 6 AM 9 AM 12 PM 3 PM Fri1 Sat 2 Sun 3 Mon 4 Tue 5 Wed 6 Thu Fri 8 SH 20 12 40 269 49 299 52 37 53 299 45 41 45 24 31 33 38 18 22 16 15 14 15 3309 *10% 6 PM 9 PM 12 AM 6 AM 9 AM 12 PM 3 PM Detailed forecast Radar map Data from Foreca Show background maxTemperature: ( sourceUnit: "F" uom: "unit:degc" - values: . validTime: "2019-02-01T15:00:00+00:00/PT11H", value: 11.111111111111143 . validTime: "2019-62-02T13:00:00+00:00/PT13H", value: 11.111111111111143 } -( validTime: "2019-02-03T13:00:00+00:00/PT13H", value: 14.444444444444514 }, validTime: "2019-02-04T13:00:00+00:00/PT134", value: 3.3333333333333712 ). - validTime: "2019-02-05T13:00:00+00:00/PT134", value: . validTime: "2019-02-06T13:00:00+00:00/PT13H", value: -8.5555555555555429 . validTime: "2019-02-07T13:00:00+00:00/PT13H", value: -5 }, validTime: "2019-02-08T13:00:00+08:00/PT131", value: -1.6666666666666288 > The endpoint breaks up data into zones. To retrieve the forecast zones you'll need for the above API call, you'll need to first make an API call to retrieve the zone data via latitude and longitude coordinates: properties: @id: "https://api.weather.gov/points/39.7456,-97.9892", @type: "wx:Point", cwa: "TOP", forecastoffice: "https://api.weather.gov/offices/TOP", gridx: 31, gridy: 80, forecast: "https://api.weather.gov/gridpoints/TOP/31,80/forecast", forecastHourly: "https://api.weather.gov/gridpoints/TOP/31,80/forecast/hourly", forecastGridData: "https://api.weather.gov/gridpoints/TOP/31,89", observationstations: "https://api.weather.gov/gridpoints/TOP/31,80/stations", relativeLocation: { type: "Feature", geometry: { type: "Point", - coordinates: [ -97.086661, 39.679376 ] }, For your screen, the user should be able to change your weather grid by entering their zip code. You'll need to convert their zip code into latitude and longitude coordinates. MapQuest has an open API you can use for that data as well: Problem 1: Weather Problem (30 pts) For these three assignments, data will be provided to you via several publicly accessible endpoints. Some end points might involve you creating an account to obtain a free API key. Feel free to implement these using any approach using AJAX (either with call backs, promises or even ES6 generators.) For the first assignment, I want you to create me a weather forecast screen similarly to how Bing does it: Lower Allen Township, PA Updated few minutes ago 12 h 20 12 Precipitation: 50% Wind: 1 MPH Humidity: 86% Cloudy. Fri 1,5:43 PM 6 PM 9 PM 12 AM 3 AM 6 AM 9 AM 12 PM 3 PM Fri1 Sat 2 Sun 3 Mon 4 Tue 5 Wed 6 Thu Fri 8 SH 20 12 40 269 49 299 52 37 53 299 45 41 45 24 31 33 38 18 22 16 15 14 15 3309 *10% 6 PM 9 PM 12 AM 6 AM 9 AM 12 PM 3 PM Detailed forecast Radar map Data from Foreca Show background maxTemperature: ( sourceUnit: "F" uom: "unit:degc" - values: . validTime: "2019-02-01T15:00:00+00:00/PT11H", value: 11.111111111111143 . validTime: "2019-62-02T13:00:00+00:00/PT13H", value: 11.111111111111143 } -( validTime: "2019-02-03T13:00:00+00:00/PT13H", value: 14.444444444444514 }, validTime: "2019-02-04T13:00:00+00:00/PT134", value: 3.3333333333333712 ). - validTime: "2019-02-05T13:00:00+00:00/PT134", value: . validTime: "2019-02-06T13:00:00+00:00/PT13H", value: -8.5555555555555429 . validTime: "2019-02-07T13:00:00+00:00/PT13H", value: -5 }, validTime: "2019-02-08T13:00:00+08:00/PT131", value: -1.6666666666666288 > The endpoint breaks up data into zones. To retrieve the forecast zones you'll need for the above API call, you'll need to first make an API call to retrieve the zone data via latitude and longitude coordinates: properties: @id: "https://api.weather.gov/points/39.7456,-97.9892", @type: "wx:Point", cwa: "TOP", forecastoffice: "https://api.weather.gov/offices/TOP", gridx: 31, gridy: 80, forecast: "https://api.weather.gov/gridpoints/TOP/31,80/forecast", forecastHourly: "https://api.weather.gov/gridpoints/TOP/31,80/forecast/hourly", forecastGridData: "https://api.weather.gov/gridpoints/TOP/31,89", observationstations: "https://api.weather.gov/gridpoints/TOP/31,80/stations", relativeLocation: { type: "Feature", geometry: { type: "Point", - coordinates: [ -97.086661, 39.679376 ] }, For your screen, the user should be able to change your weather grid by entering their zip code. You'll need to convert their zip code into latitude and longitude coordinates. MapQuest has an open API you can use for that data as well