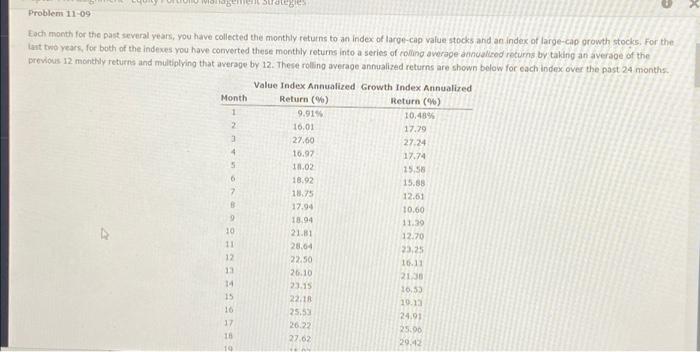
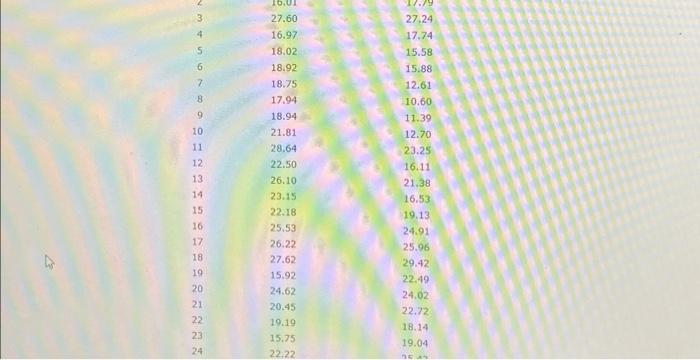
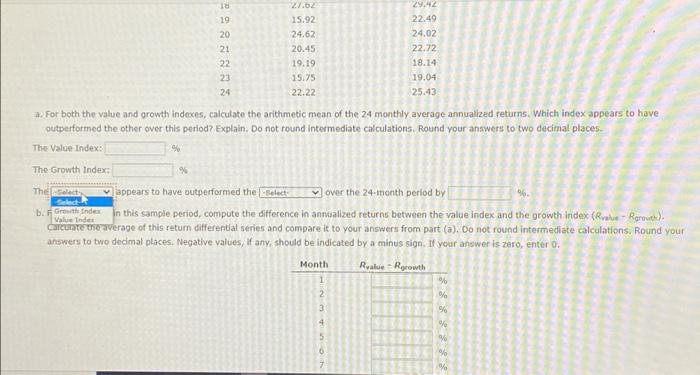
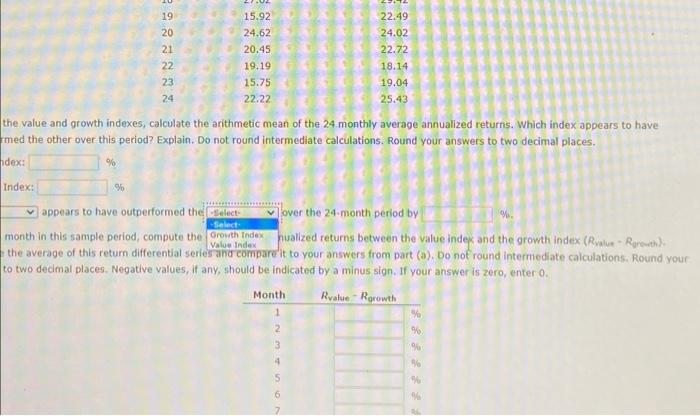
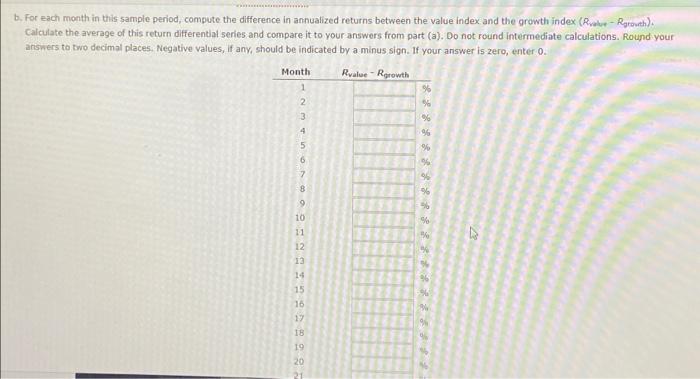
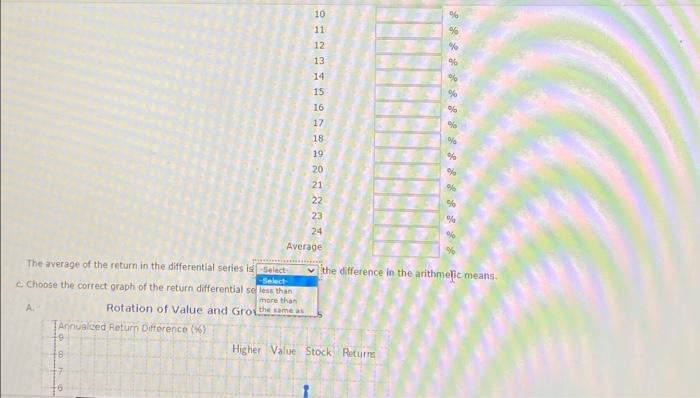
Problem 11-09 Each month for the past several years, you have collected the monthly returns to an index of large-cap value stocks and an index of large-cap growth stocks. For the last two years, for both of the indexes you have converted these monthly returns into a series of rolling average annualized returns by taking an average of the previous 12 monthly returns and multiplying that average by 12. These rolling average annualized returns are shown below for each index over the past 24 months. Month 1 2 3 4 5 6 7 B 9 ent strategies 10 11 12 13 14 15 16 17 16 19 Value Index Annualized Growth Index Annualized Return (%) Return (96) 9.91% 16.01 27.60 16.97 18.02 18.92 18.75 17.94 18.94 21.81 28.64 22.50 26.10 23.15 22.18 25.53 26.22 27.62 10,48% 17.79 27.24 17.74 15.58 15.88 12.61 10.60 11.39 12.70 23,25 16.11 21.38 10.33 19.13 24.91 25.90 29.42 X 6 7 8 9 10 11 12. 13 14 15 16 17 18 19 20 21 22 23 24 16.01 27.60 16.97 18.02 18.92 18.75 17.94 18.94 21.81 28.64 22.50 26.10 23.15 22.18 25.53 26.22 27.62 15.92 24.62 20.45 19.19 15.75 22.22 $1177.79 27,24 17.74 15.58 15.88 12.61 10.60 11.39 12.70 23.25 16.11 21.38 16.53 19.13 24.91 25.96 29.42 22.49 24.02 22.72 18.14 19.04 35 43 18 222222Z % 19 20 21 23 24 27.62 15.92 24.62 20.45 19.19 15.75 22.22 a. For both the value and growth indexes, calculate the arithmetic mean of the 24 monthly average annualized returns. Which index appears to have outperformed the other over this period? Explain. Do not round intermediate calculations. Round your answers to two decimal places. The Value Index: % The Growth Index: 29.42 22.49 24.02 22.72 18.14 2 3 19.04 25.43 The Select %. appears to have outperformed the -Select- over the 24-month period by Select Value b. Growth Index in this sample period, compute the difference in annualized returns between the value index and the growth index (Rvalue-Rarouth). Calculate the average of this return differential series and compare it to your answers from part (a). Do not round intermediate calculations. Round your answers to two decimal places. Negative values, if any, should be indicated by a minus sign. If your answer is zero, enter 0. Month Realue Rgrowth 5 % % % % 3987222 % 19 20 21 24 15.92 24.62 20.45 19.19 15.75 22.22 the value and growth indexes, calculate the arithmetic mean of the 24 monthly average annualized returns. Which index appears to have med the other over this period? Explain. Do not round intermediate calculations. Round your answers to two decimal places. ndex: Index: 22.49 24.02 22.72 18.14 19.04 25.43 over the 24-month period by appears to have outperformed the -Select- -Select- Value Index month in this sample period, compute the Growth Index hualized returns between the value index and the growth index (Rvalue-Rgrowth) the average of this return differential series and compare it to your answers from part (a). Do not round intermediate calculations. Round your to two decimal places. Negative values, if any, should be indicated by a minus sign. If your answer is zero, enter 0. RvalueRgrowth Month 1 2 3 4 % **** % % % % % AL %. b. For each month in this sample period, compute the difference in annualized returns between the value index and the growth index (Rvalue-growth) Calculate the average of this return differential series and compare it to your answers from part (a). Do not round intermediate calculations. Round your answers to two decimal places. Negative values, if any, should be indicated by a minus sign. If your answer is zero, enter 0. Rvalue-Rgrowth Month 1 283335 GIBRES OWN- 12 13 14 15 16 17 18 19 20 21 % % % % % % % % % % % % % % 5% P % % D The average of the return in the differential series is Select -Select- c. Choose the correct graph of the return differential se less than Rotation of Value and Grot the same as more than Annualced Return Difference (%) A. 19 8 1 1 10 11 12 13 14. 15 16 17 18 19 20 21 22 23 24 Average % Higher Value Stock Returns % % % % % of % % % % % % % % the difference in the arithmelic means