Answered step by step
Verified Expert Solution
Link Copied!

Question

1 Approved Answer

Problem 11.5 Tabulated data from the tension test of steel is shown below. Calculate stress and the corresponding strain and draw a complete stress-strain curve.
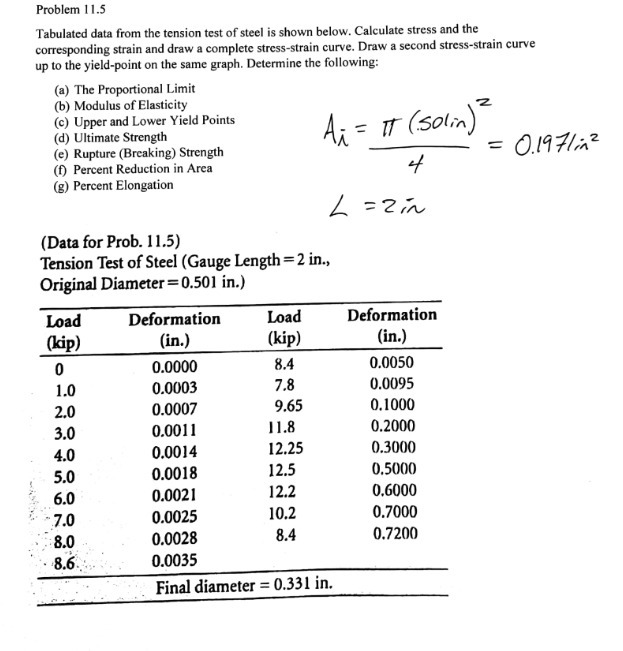
image text in transcribed
Problem 11.5 Tabulated data from the tension test of steel is shown below. Calculate stress and the corresponding strain and draw a complete stress-strain curve. Draw a second stress-strain curve up to the yield-point on the same graph. Determine the following: (a) The Proportional Limit (b) Modulus of Elasticity (c) Upper and Lower Yield Points (d) Ultimate Strength An = IT ( solin ) (e) Rupture (Breaking) Strength = 0.197/in 2 (f) Percent Reduction in Area (g) Percent Elongation L = 2 in (Data for Prob. 11.5) Tension Test of Steel (Gauge Length = 2 in., Original Diameter = 0.501 in.) Load Deformation Load Deformation (kip) (in.) (kip) (in.) 0 0.0000 8.4 0.0050 1.0 0.0003 7.8 0.0095 2.0 0.0007 9.65 0.1000 3.0 0.0011 1 1.8 0.2000 4.0 0.0014 12.25 0.3000 5.0 0.0018 12.5 0.5000 6.0 0.0021 12.2 0.6000 7.0 0.0025 10.2 0.7000 8.0 0.0028 8.4 0.7200 8.6. 0.0035 Final diameter = 0.331 in

Step by Step Solution

There are 3 Steps involved in it

Step: 1

blur-text-image

Get Instant Access to Expert-Tailored Solutions

See step-by-step solutions with expert insights and AI powered tools for academic success

Step: 2

blur-text-image_2

Step: 3

blur-text-image_3

Ace Your Homework with AI

Get the answers you need in no time with our AI-driven, step-by-step assistance

Get Started

Recommended Textbook for

Finite Geometry And Combinatorics

Authors: F De Clerck ,J Hirschfeld

1st Edition

0521448506, 978-0521448505

More Books

Students also viewed these Mathematics questions