Answered step by step
Verified Expert Solution
Link Copied!

Question

1 Approved Answer

Problem 11-5 Using the data in the following table, estimate (a) the average return and volatility for each stock, (b) the covariance between the stocks,
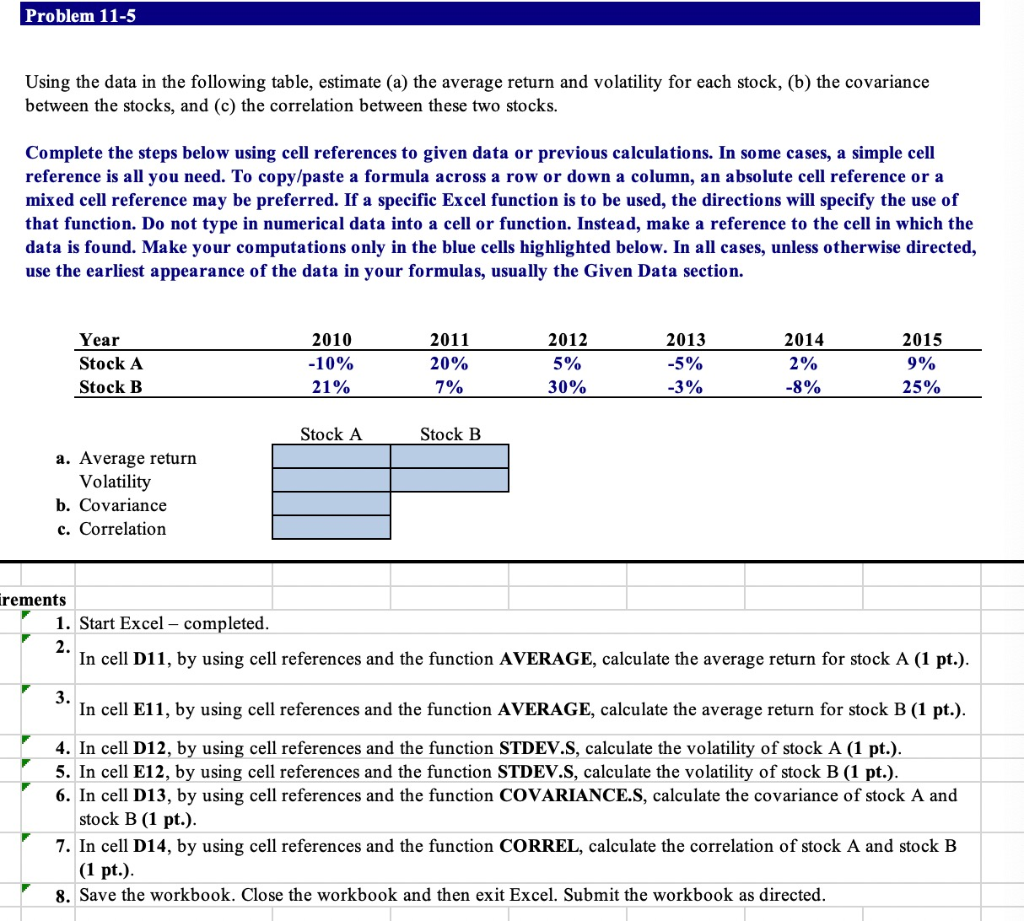
image text in transcribed

Problem 11-5 Using the data in the following table, estimate (a) the average return and volatility for each stock, (b) the covariance between the stocks, and (c) the correlation between these two stocks. Complete the steps below using cell references to given data or previous calculations. In some cases, a simple cell reference is all you need. To copy/paste a formula across a row or down a column, an absolute cell reference or a mixed cell reference may be preferred. If a specific Excel function is to be used, the directions will specify the use of that function. Do not type in numerical data into a cell or function. Instead, make a reference to the cell in which the data is found. Make your computations only in the blue cells highlighted below. In all cases, unless otherwise directed, use the earliest appearance of the data in your formulas, usually the Given Data section. Year Stock A Stock B 2010 -10% 21% 2011 20% 7% 2012 5% 30% 2013 -5% -3% 2014 2% -8% 2015 9% 25% Stock A Stock B a. Average return Volatility b. Covariance c. Correlation irements 1. Start Excel - completed. 2. In cell D11, by using cell references and the function AVERAGE, calculate the average return for stock A (1 pt.). 3. In cell E11, by using cell references and the function AVERAGE, calculate the average return for stock B (1 pt.). 4. In cell D12, by using cell references and the function STDEV.S, calculate the volatility of stock A (1 pt.). 5. In cell E12, by using cell references and the function STDEV.S, calculate the volatility of stock B (1 pt.). 6. In cell D13, by using cell references and the function COVARIANCE.S, calculate the covariance of stock A and stock B (1 pt.). 7. In cell D14, by using cell references and the function CORREL, calculate the correlation of stock A and stock B (1 pt.) 8. Save the workbook. Close the workbook and then exit Excel. Submit the workbook as directed

Step by Step Solution

There are 3 Steps involved in it

Step: 1

blur-text-image

Get Instant Access to Expert-Tailored Solutions

See step-by-step solutions with expert insights and AI powered tools for academic success

Step: 2

blur-text-image

Step: 3

blur-text-image

Ace Your Homework with AI

Get the answers you need in no time with our AI-driven, step-by-step assistance

Get Started

Recommended Textbook for

Foundations of Financial Management

Authors: Stanley Block, Geoffrey Hirt, Bartley Danielsen

15th edition

77861612, 1259194078, 978-0077861612, 978-1259194078

More Books

Students also viewed these Finance questions