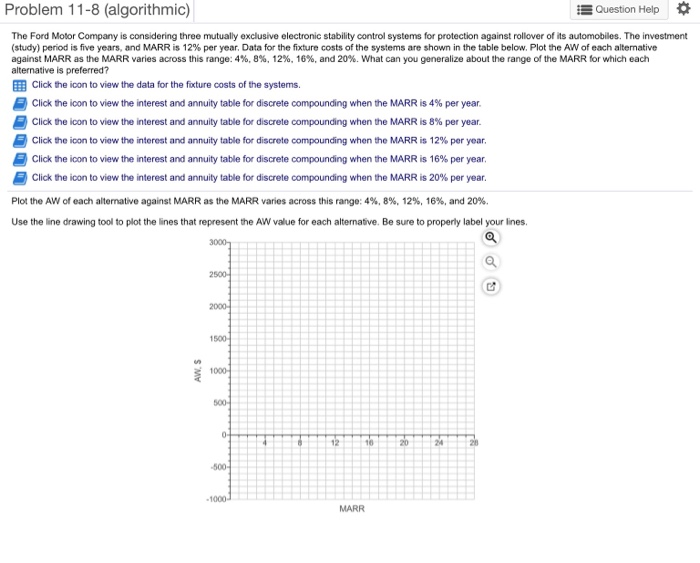
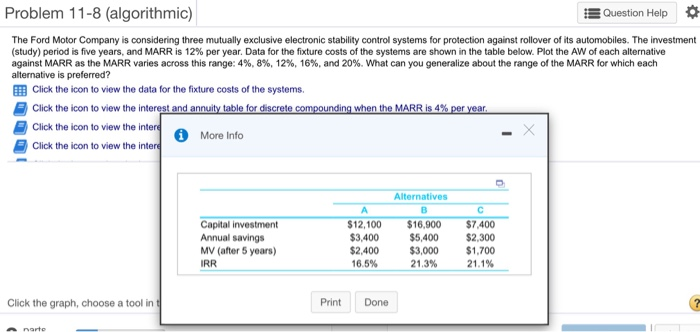
Problem 11-8 (algorithmic) Question Help * The Ford Motor Company is considering three mutually exclusive electronic stability control systems for protection against rollover of its automobiles. The investment (study) period is five years, and MARR is 12% per year. Data for the fixture costs of the systems are shown in the table below. Plot the AW of each altemative against MARR as the MARR varies across this range: 4% 8% 12% 16%, and 20%, what can you generalize about the range of the MARR for which each alternative is preferred? EE Click the icon to view the data for the fixture costs of the systems Click the icon to view the interest and annuity table for discrete compounding when the MARR is 4% per year. Click the icon to view th e interest and annuity table for discrete compounding when the MARR is 8% per year. Click the icon to view the interest and annuity table for dis te compounding when the MARR is 12% per year. Click the icon to view the interest and annuity table for discrete compounding when the MARR is 16% per year. Click the icon to view the interest and annuity table for discrete compounding when the MARR is 20% per year. Plot the AW of each alternative against MARR as the MARR varies across this range: 4%, 8%, 12%, 16%, and 20%. Use the line drawing tool to plot the lines that represent the AW value for each alternative. Be sure to properly label your lines 12 10 20 24 1000 MARR Problem 11-8 (algorithmic) Question Help * The Ford Motor Company is considering three mutually exclusive electronic stability control systems for protection against rollover of its automobiles. The investment (study) period is five years, and MARR is 12% per year. Data for the fixture costs of the systems are shown in the table below. Plot the AW of each alternative against MARR as the MARR varies across this range: 4%, 8%, 12%, 16%, and 20%. What can you generalize about the range of the MARR for which each EB Click the icon to view the data for the fixture costs of the systems. Click the icon to view the i nt MARR is 4 Click the icon to view the int O More Info Click the icon to view the inter Alternatives Capital investment Annual savings MV (after 5 years) IRR $12,100 $16,900 $7,400 $5,400 $2,300 $3,000 $1,700 21.1% $3,400 $2,400 16 5% 21.3% Click the graph, choose a tool in Print Done


