

Answered step by step
Verified Expert Solution
Question
1 Approved Answer
Problem 12-6A Use ratios to analyze risk and profitability (LO12-3, 12-4) (The following information applies to the questions displayed below.] Income statements and balance sheets
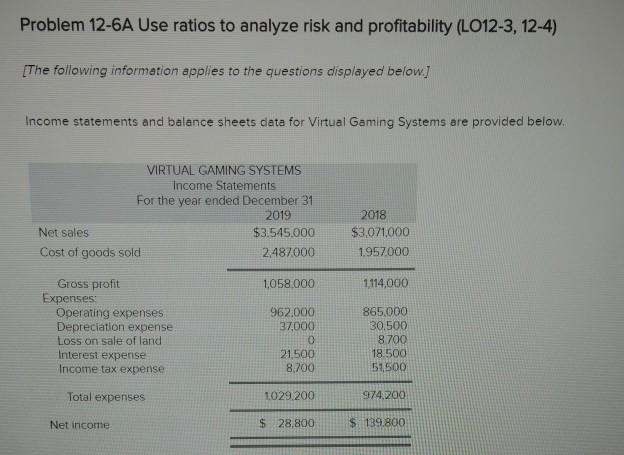
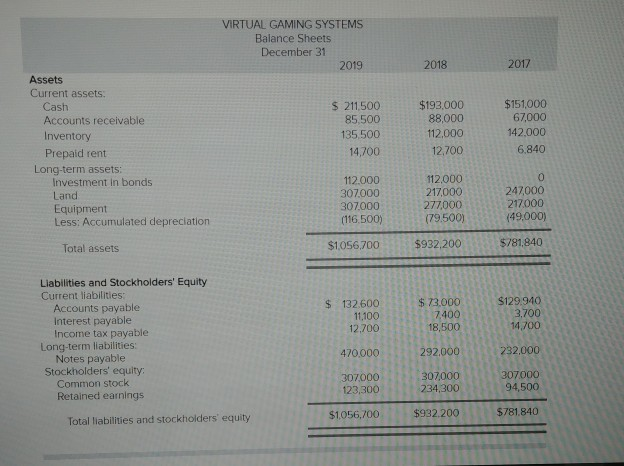
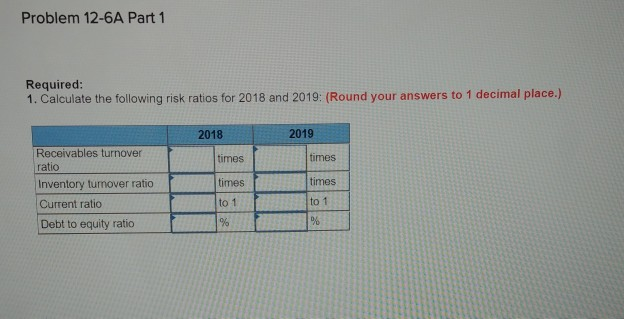
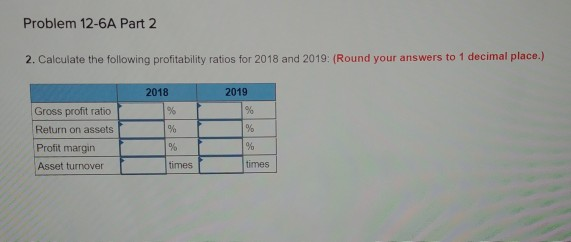
Problem 12-6A Use ratios to analyze risk and profitability (LO12-3, 12-4) (The following information applies to the questions displayed below.] Income statements and balance sheets data for Virtual Gaming Systems are provided below. VIRTUAL GAMING SYSTEMS Income Statements For the year ended December 31 2019 Net sales $3.545,000 Cost of goods sold 2.487000 2018 $3,071,000 1957.000 1,058.000 1,114,000 Gross profit Expenses Operating expenses Depreciation expense Loss on sale of land Interest expense Income tax expense 962,000 37,000 865,000 30.500 8.700 18.500 51,500 21,500 8.700 Total expenses 974,200 1029.200 $ 28,800 Net income $ 139 800 VIRTUAL GAMING SYSTEMS Balance Sheets December 31 2019 2018 2017 Assets Current assets. Cash Accounts receivable Inventory Prepaid rent Long-term assets: Investment in bonds Land Equipment Less: Accumulated depreciation $ 211,500 85,500 135.500 14,700 $193.000 88,000 112,000 12,700 $151,000 67.000 142.000 6.840 112.000 307.000 307.000 (116.500) 112,000 217.000 277,000 (79.500) 247000 217.000 (49,000) Total assets $1056700 $932,200 $781.840 $ 132.600 11,100 12,700 Liabilities and Stockholders' Equity Current liabilities Accounts payable Interest payable Income tax payable Long-term liabilities: Notes payable Stockholders' equity: Common stock Retained earnings $ 73,000 7.400 18,500 292,000 $129.940 3.700 14,700 232,000 470.000 307000 123,300 3 07,000 234,300 932.200 307000 9 4,500 $781.840 Total liabilities and stockholders' equity $1056,700 Problem 12-6A Part 1 Required: 1. Calculate the following risk ratios for 2018 and 2019: (Round your answers to 1 decimal place.) 2018 2019 times times times times Receivables turnover ratio Inventory tumover ratio Current ratio Debt to equity ratio to 1 Problem 12-6A Part 2 2. Calculate the following profitability ratios for 2018 and 2019: (Round your answers to 1 decimal place.) 2018 2019 Gross profit ratio Return on assets Profit margin Asset turnover times times
Step by Step Solution
There are 3 Steps involved in it
Step: 1

Get Instant Access to Expert-Tailored Solutions
See step-by-step solutions with expert insights and AI powered tools for academic success
Step: 2

Step: 3
Ace Your Homework with AI
Get the answers you need in no time with our AI-driven, step-by-step assistance
Get Started
Accounting And Auditing Standards For Islamic Financial Institutions
Authors: Mohd MaSum Billah
1st Edition
103206353X, 978-1032063539