

Answered step by step
Verified Expert Solution
Question
1 Approved Answer
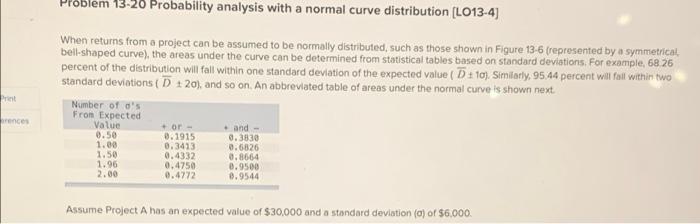
Problem 13-20 Probability analysis with a normal curve distribution (LO13-4) Print When returns from a project can be assumed to be normally distributed, such as
Step by Step Solution
There are 3 Steps involved in it
Step: 1

Get Instant Access to Expert-Tailored Solutions
See step-by-step solutions with expert insights and AI powered tools for academic success
Step: 2

Step: 3
Ace Your Homework with AI
Get the answers you need in no time with our AI-driven, step-by-step assistance
Get Started
Small Brewery Finance
Authors: Maria Pearman
1st Edition
1938469526, 978-1938469527