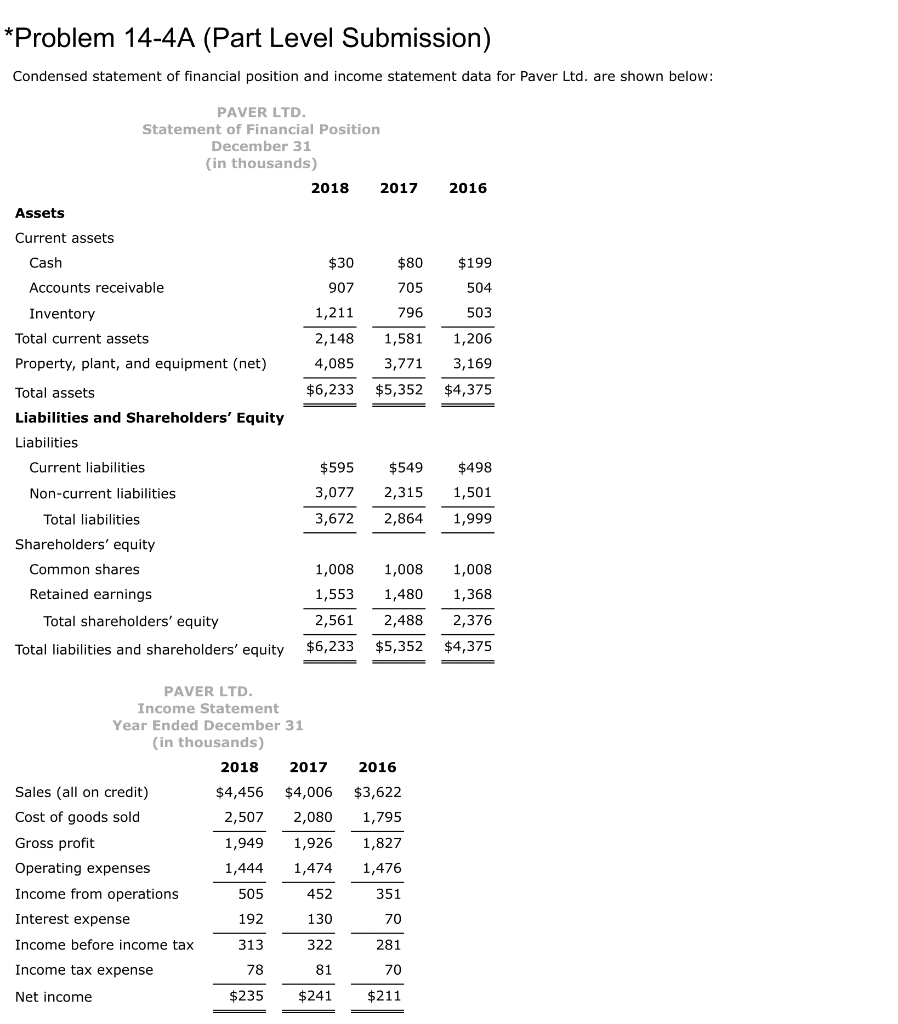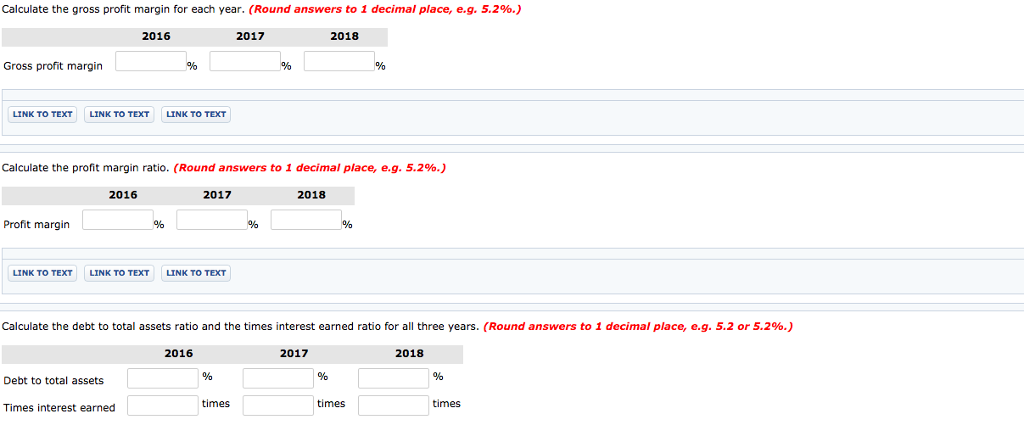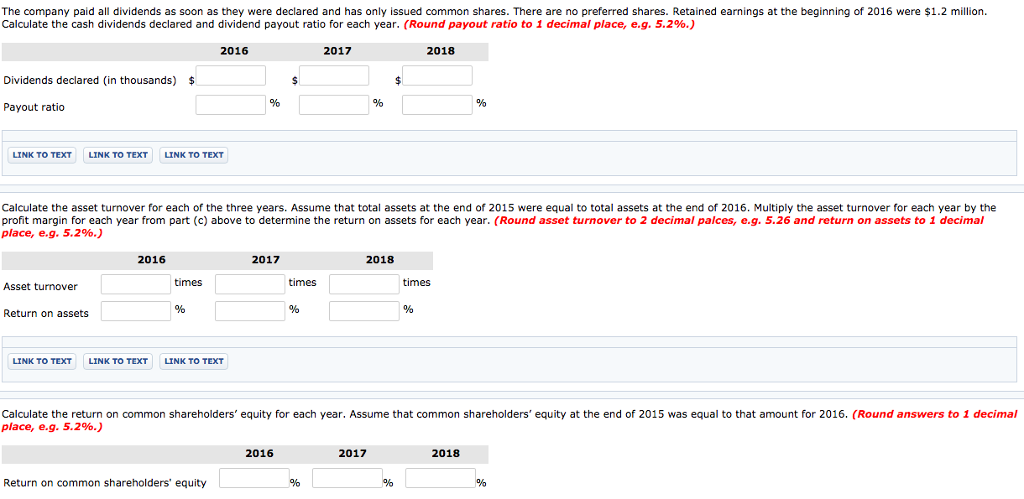


*Problem 14-4A (Part Level Submission) Condensed statement of financial position and income statement data for Paver Ltd. are shown below: PAVER LTD Statement of Financial Position December 31 in thousands) 2018 2017 2016 Assets Current assets $30 907 1,211 Cash $80 $199 504 503 2,148 1,581 1,206 4,0853,7713,169 $6,233 $5,352 $4,37!5 Accounts receivable 705 796 Inventory Total current assets Property, plant, and equipment (net) Total assets Liabilities and Shareholders' Equity Liabilities $595$549 $498 3,0772,315 1,501 3,672 2,864 1,999 Current liabilities Non-current liabilities Total liabilities Shareholders' equity Common shares Retained earnings 1,0081,0081,008 1,553 1,480 1,368 2,561 2,488 2,376 Total liabilities and shareholders' equity $6,233 $5,352 $4,375 Total shareholders' equity PAVER LTD Income Statement Year Ended December 31 in thousands) Sales (all on credit) Cost of goods sold Gross profit Operating expenses Income from operations Interest expense Income before income tax Income tax expense Net income 2018 2017 2016 $4,456 $4,006 $3,622 2,5072,0801,795 1,9491,926 1,827 1,4441,4741,476 351 70 281 70 $235$241 $211 505 192 313 78 452 130 322 81 Calculate the receivables turnover ratio, inventory turnover ratio, and current ratio for all three years. Assume that the accounts receivable and inventory balances at the end of 2015 were equal to the balances at the end of 2016, The company does not have an allowance for doubtful accounts and all sales are on credit. (Round answers to 1 decimal place, e.g. 5.2%.) 2016 2018 times times times Receivables turnover Inventory turnover Current ratio times times times Calculate the gross profit margin for each year. (Round answers to 1 decimal place, e.g. 5.2%.) 2016 2017 2018 Gross profit margin LINK TO TEXT LINK TO TEXT LINK TO TEXT Calculate the profit margin ratio. (Round answers to 1 decimal place, e.g. 5.2% 2016 2017 2018 Profit margin LINK TO TEXT LINK TO TEXTLINK TO TEXT Calculate the debt to total assets ratio and the times interest earned ratio for all three years. (Round answers to 1 decimal place, e.g. 5.2 or 5.2%.) 2016 2017 2018 Debt to total assets times times times Times interest earned The company paid all dividends as soon as they were declared and has only issued common shares. There are no preferred shares. Retained earnings at the beginning of 2016 were $1.2 million. Calculate the cash dividends declared and dividend payout ratio for each year. (Round payout ratio to 1 decimal place, eg, 5.2%.) 2016 2017 2018 Dividends declared (in thousands) $ Payout ratio LINK TO TEXT LINK TO TEXT LINK TO TEXT Calculate the asset turnover for each of the three years. Assume that total assets at the end of 2015 were equal to total assets at the end of 2016. Multiply the asset turnover for each year by the profit margin for each year from part (c) above to determine the return on assets for each year. (Round asset turnover to 2 decimal palces, e.g. 5.26 and return on assets to 1 decimal place, e.g. 5.2%.) 2016 2017 2018 times times times Asset turnover Return on assets LINK TO TEXT LINK TO TEXT LINK TO TEXT Calculate the return on common shareholders' equity for each year. Assume that common shareholders' equity at the end of 2015 was equal to that amount for 2016. (Round answers to 1 decimal place, eg. 5.2%.) 2016 2017 2018 Return on common shareholders' equity


