

Answered step by step
Verified Expert Solution
Question
1 Approved Answer
problem 17 - 2A ratios, common size, and the trend percent LO, P1, P3, P3 17 GRADED PROBLEM 6 Required Informetion Problem 17-2A Ratios, common-size
problem 17 - 2A ratios, common size, and the trend percent LO, P1, P3, P3
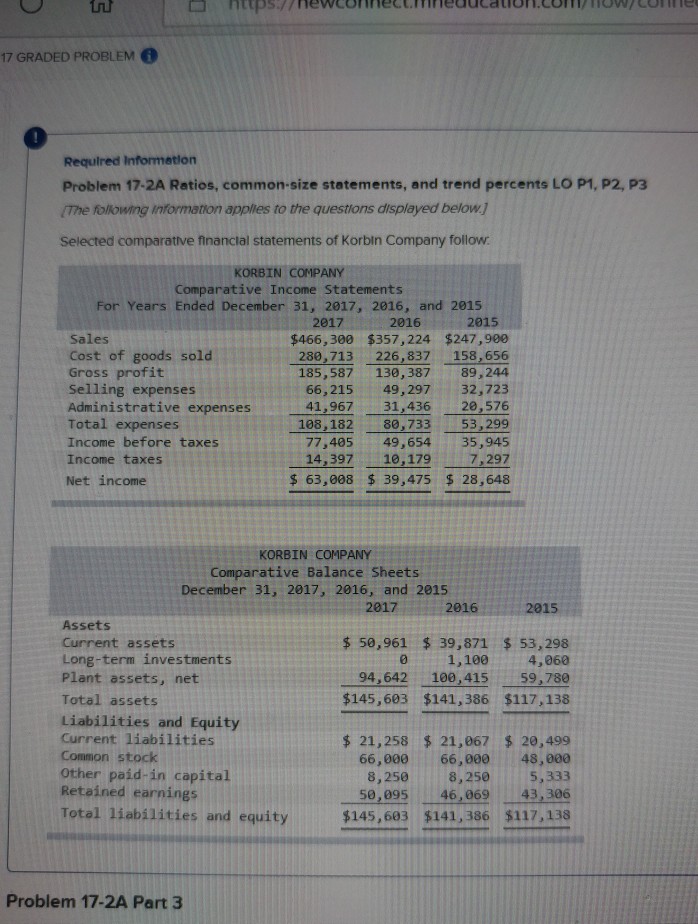
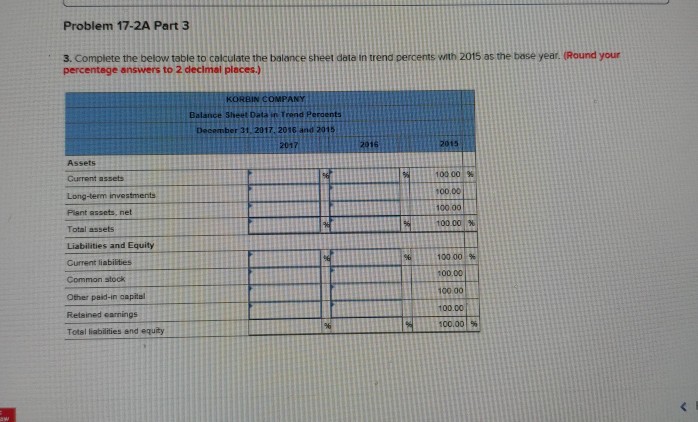
17 GRADED PROBLEM 6 Required Informetion Problem 17-2A Ratios, common-size statements, and trend percents LO P1, P2, P3 (The folowing informaton applies to the questions displayed below Selected comparative financlal statements of Korbln Company follow KORBIN COMPANY Comparative Income Statements For Years Ended December 31, 2017, 2016, and 2015 Sales Cost of goods sold Gross profit Selling expenses Administrative expenses Total expenses Income before taxes Income taxes Net income 201720162015 $466,300 $357,224 $247,900 280,713 226,837 158,656 185,587 130,387 89,244 66,215 49,297 32,723 41,967 31,436 2e,576 108,18280,733 53,299 77,40549,654 35,945 14,397 10,179 7,297 $ 63,008 $ 39,475 $ 28,648 KORBIN COMPANY Comparative Balance Sheets December 31, 2017, 2016, and 2015 2017 2016 2015 Assets Current assetS Long-term investments Plant assets, net Total assets $ 50,961 39,871 $ 53,298 4,060 94,642 100,415 59,780 $145,603 $141,386 $117,138 0 1,100 Liabilities and Equity Current liabilities Common stock Other paid-in capital Retained earnings $ 21,258 $21,067 $ 20,499 66,000 66,000 48,000 8,250 8,2505,333 50,095 46,06943,306 Total liabilities and equity $145,603 $141, 386 $117,.138 Problem 17-2A Part 3
Step by Step Solution
There are 3 Steps involved in it
Step: 1

Get Instant Access to Expert-Tailored Solutions
See step-by-step solutions with expert insights and AI powered tools for academic success
Step: 2

Step: 3
Ace Your Homework with AI
Get the answers you need in no time with our AI-driven, step-by-step assistance
Get Started
Wiley Federal Government Auditing Laws Regulations Standards Practices And Sarbanes Oxley
Authors: Cornelius E. Tierney, Edward F. Kearney, Roldan Fernandez, Jeffrey W. Green, Kearney & Company
1st Edition