

Answered step by step
Verified Expert Solution
Question
1 Approved Answer
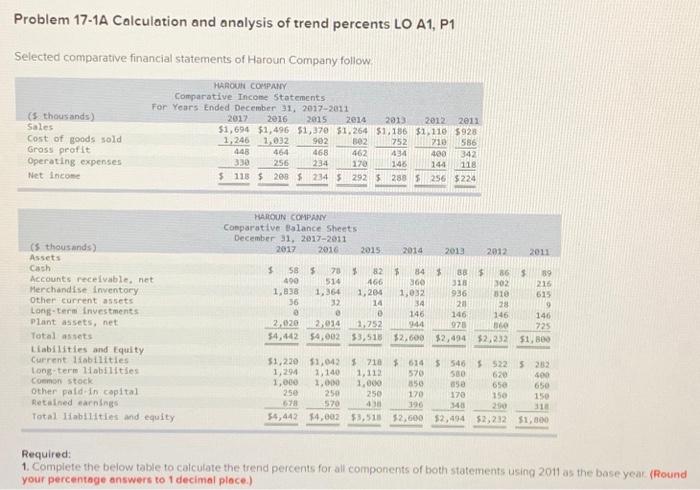
Problem 17-1A Calculation and analysis of trend percents LO A1, P1 Selected comparative financial statements of Haroun Company follow. HAROUN COMPANY Comparative Income Statements For
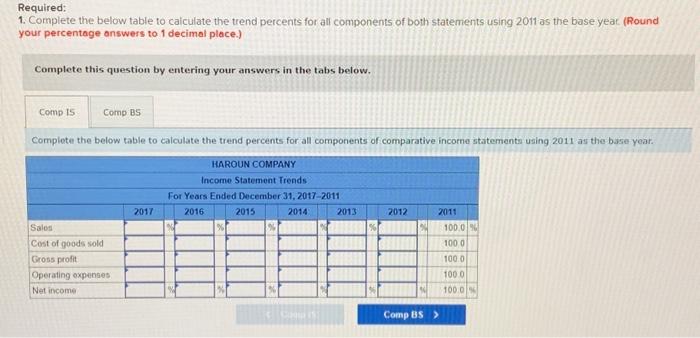
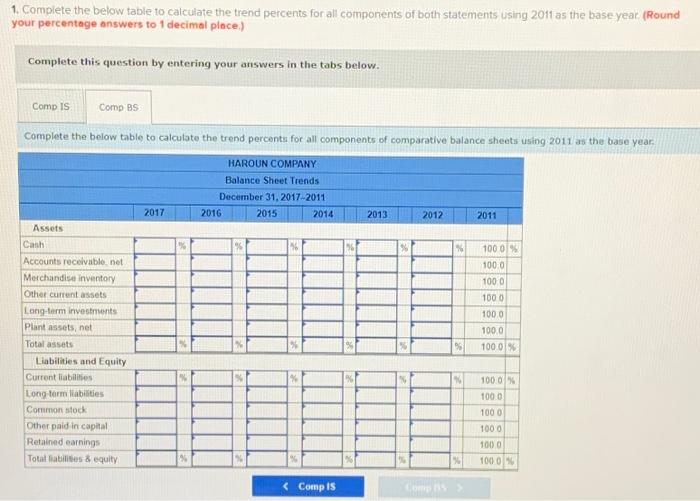
Problem 17-1A Calculation and analysis of trend percents LO A1, P1 Selected comparative financial statements of Haroun Company follow. HAROUN COMPANY Comparative Income Statements For Years Ended December 31, 2017-2011 ($ thousands) Sales Cost of goods sold Gross profit Operating expenses Net income ($ thousands) Assets Cash Accounts receivable, net Merchandise inventory Other current assets Long-term investments Plant assets, net Total assets Liabilities and Equity Current liabilities Long-term liabilities. Common stock Other paid-in capital Retained earnings Total liabilities and equity 2017 2016 2015 2014 2013 2012 2011 $1,694 $1,496 $1,370 $1,264 $1,186 $1,110 $928 1,032 710 586 1,246 448 400 342 330 144 118 118 $ 208 $ 234 $ 256 $224 $ 464 256 902 468 234 $ HAROUN COMPANY Comparative Balance Sheets December 31, 2017-2011 2017 2016 58 $ 490 1,838 36 0 802 462 170 292 $ $ 82 466 1,204 14 0 2,014 1,752 2,020 $4,442 $4,002 $3,518 78 514 1,364 32 0 2015 752 434 146 288 $ 2014 $ 84 $ 360 1,032 34 146 944 $2,600 $1,220 $1,042 $ 718 $ 1,294 1,140 1,112 1,000 1,000 1,000 250 250 678 570 $4,442 $4,002 2013 2012 $ 86 $ 88 318 302 936 810 28 28 146 146 860 978 $2,494 $2,232 614 $ 546 $ 522 580 570 620 850 850 650 250 170 170 150 438 396 348 290 $3,518 $2,600 $2,494 $2,232 2011 $ 89 216 615 9 146 725 $1,800 282 400 650 150 318 $1,800 Required: 1. Complete the below table to calculate the trend percents for all components of both statements using 2011 as the base year. (Round your percentage answers to 1 decimal place.)
Step by Step Solution
There are 3 Steps involved in it
Step: 1

Get Instant Access to Expert-Tailored Solutions
See step-by-step solutions with expert insights and AI powered tools for academic success
Step: 2

Step: 3
Ace Your Homework with AI
Get the answers you need in no time with our AI-driven, step-by-step assistance
Get Started
Purchasing Audit
Authors: ISMAIL LAMHAMDI
1st Edition
6203507563, 978-6203507560