

Answered step by step
Verified Expert Solution
Question
1 Approved Answer
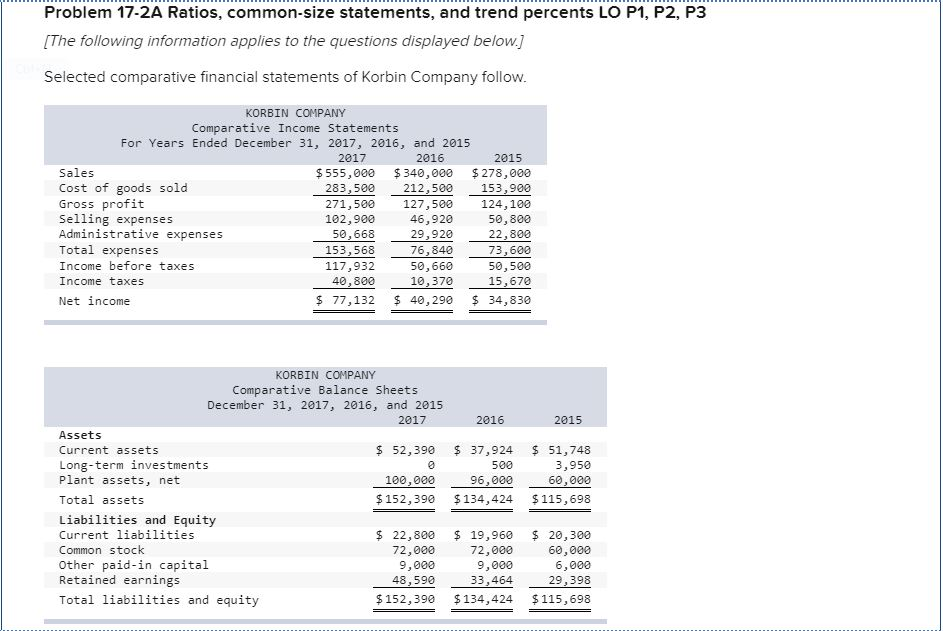
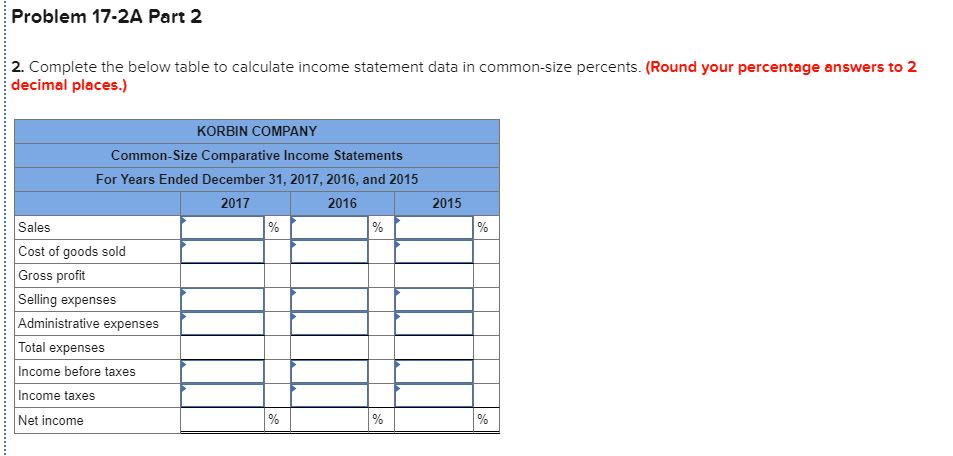
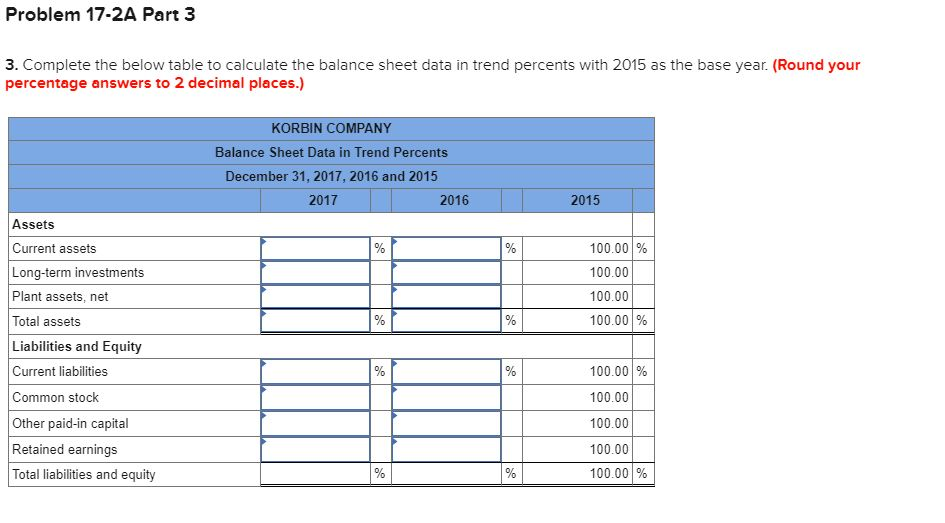
Problem 17-2A Ratios, common-size statements, and trend percents LO P1, P2, P3 [The following information applies to the questions displayed below.] Selected comparative financial statements
Step by Step Solution
There are 3 Steps involved in it
Step: 1

Get Instant Access to Expert-Tailored Solutions
See step-by-step solutions with expert insights and AI powered tools for academic success
Step: 2

Step: 3
Ace Your Homework with AI
Get the answers you need in no time with our AI-driven, step-by-step assistance
Get Started
The Life Audit Take Control Of Your Life Now Every Minutes Counts
Authors: Caroline Righton
1st Edition
978-0340836781