Answered step by step
Verified Expert Solution
Question
1 Approved Answer
Problem 2 [1 + 1+ 1+ 2: 5 marks] Accident data were analyzed to determine the number of fatal accidents for the cars of three
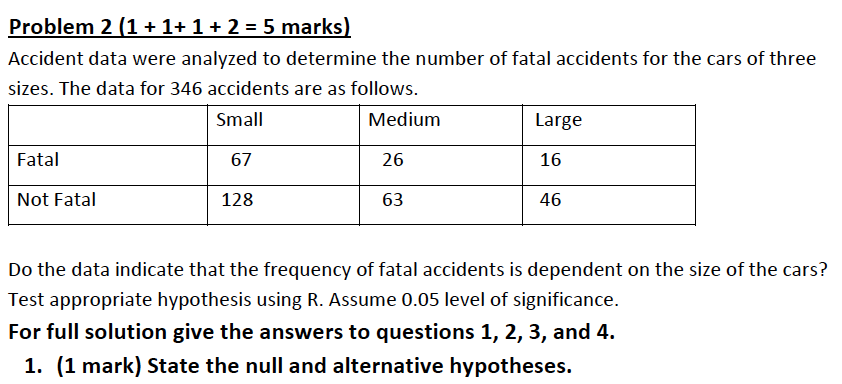
Problem 2 [1 + 1+ 1+ 2: 5 marks] Accident data were analyzed to determine the number of fatal accidents for the cars of three sizes. The data for 346 accidents are as follows. Small Medium Large Fatal 67 26 16 Not Fatal 128 63 46 Do the data indicate that the frequency of fatal accidents is dependent on the size of the cars? Test appropriate hypothesis using R. Assume 0.05 level of significance. For full solution give the answers to questions 1, 2, 3, and 4. 1. [1 mark} State the null and alternative hypotheses. 2. (1 mark} Represent contingency table with two categorical variables Type of Accident (levels: Fatal and Not Fatal} and Car Size (levels: Small, Medium, and Large} Show the code, required to answer question 2, in blue or red, and corresponding R output in black. 3. [1 mark} Perform chi - square test and represent its results. Show the code, required to answer question 3, in blue or red, and corresponding R output in black. 4. (2 marks) Make the conclusions about truth or falsity of stated hypotheses. Decide whether there is the sufficient sample evidence that the frequency of fatal accidents depends on the size of the cars
Step by Step Solution
There are 3 Steps involved in it
Step: 1
Get Instant Access to Expert-Tailored Solutions
See step-by-step solutions with expert insights and AI powered tools for academic success
Step: 2
Step: 3
Ace Your Homework with AI
Get the answers you need in no time with our AI-driven, step-by-step assistance
Get Started