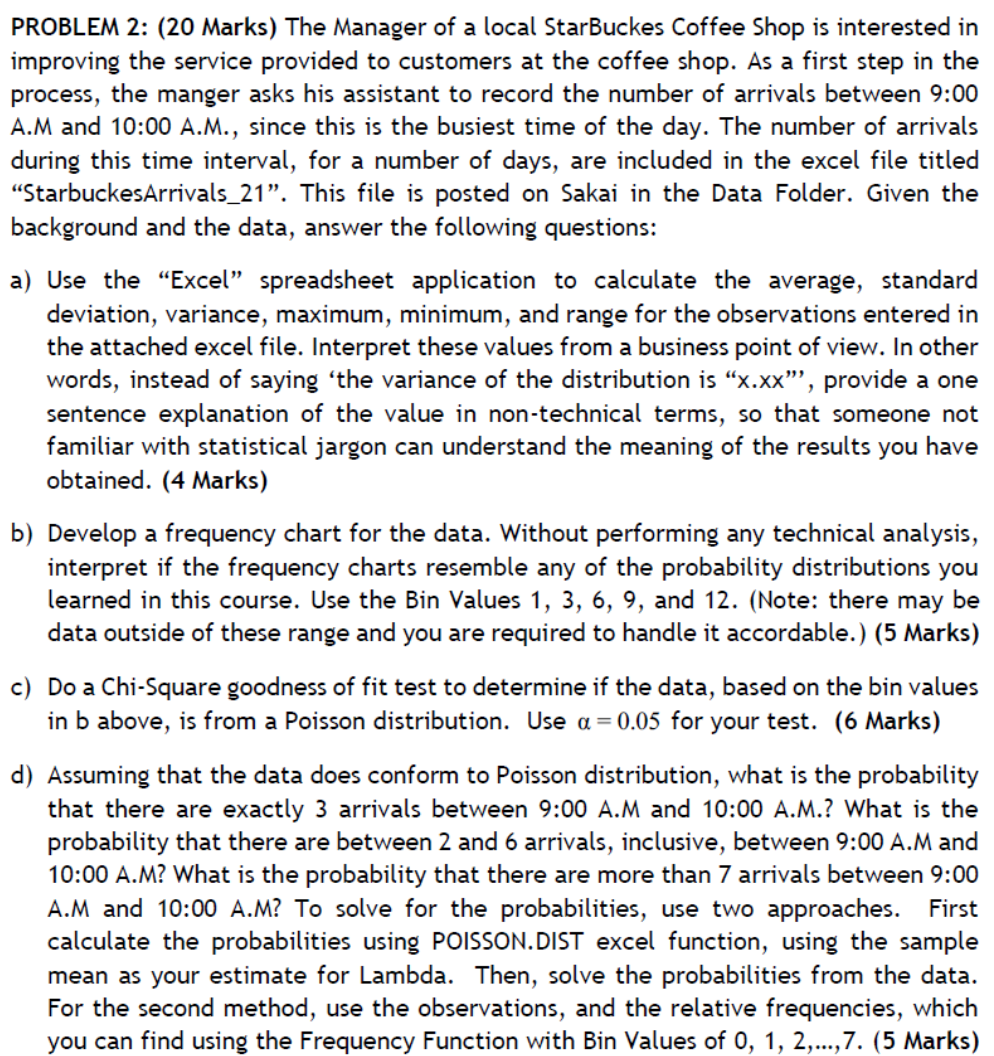
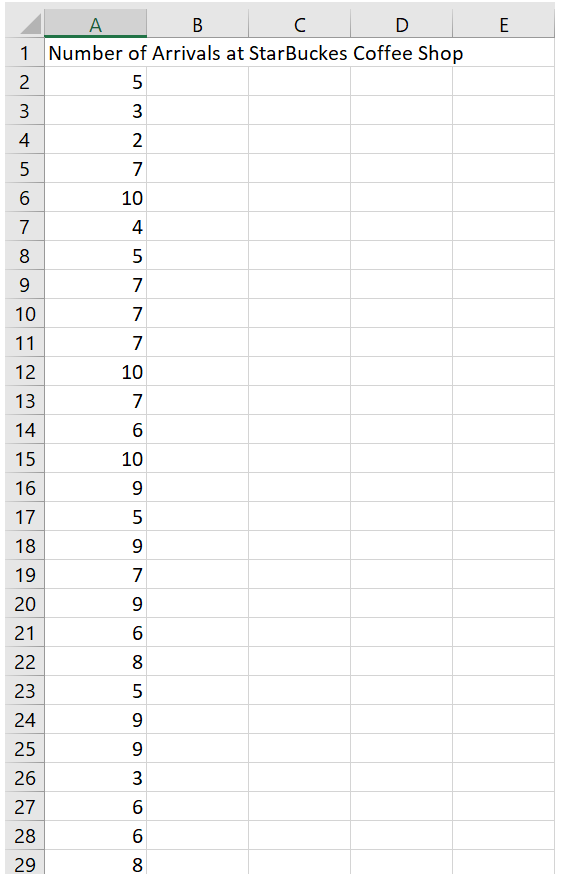
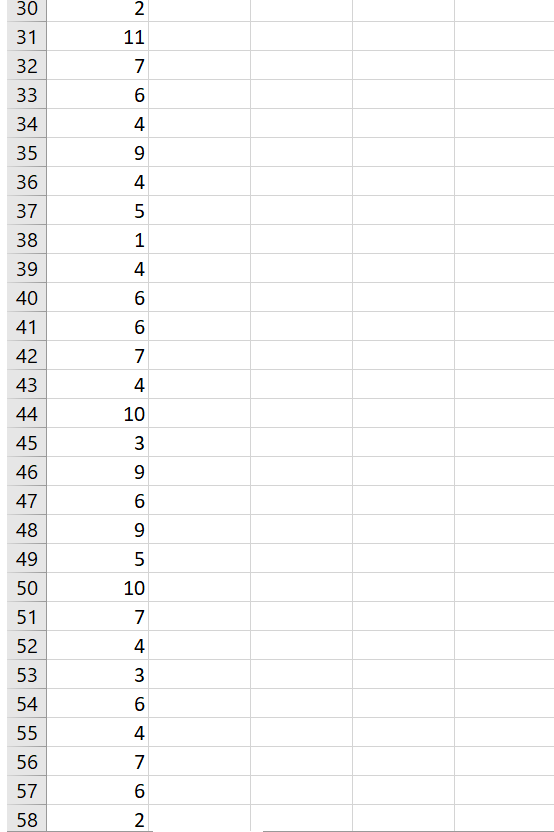
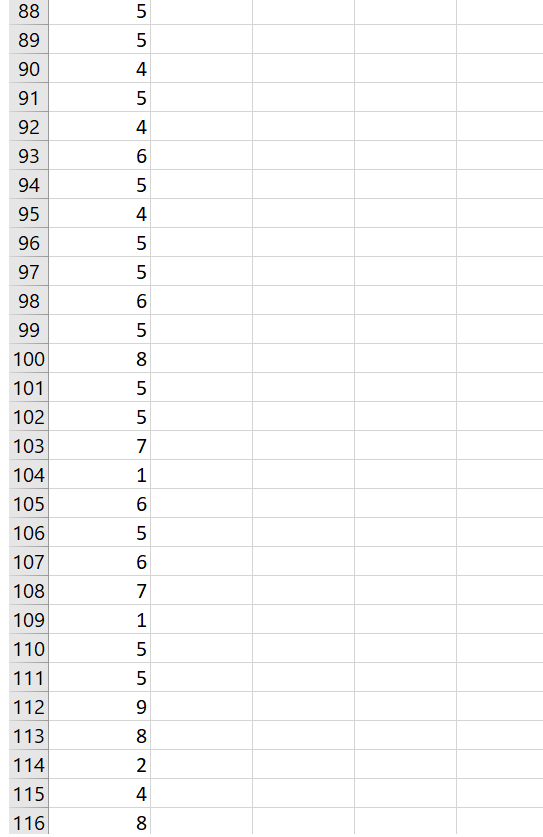
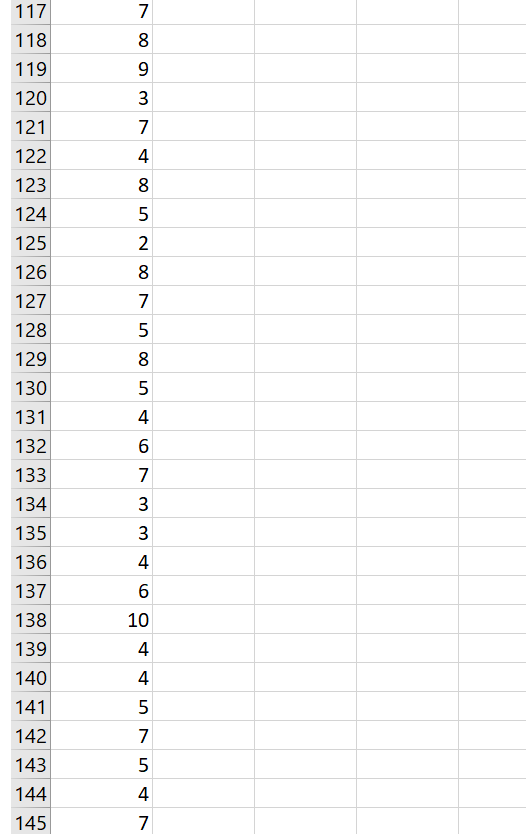
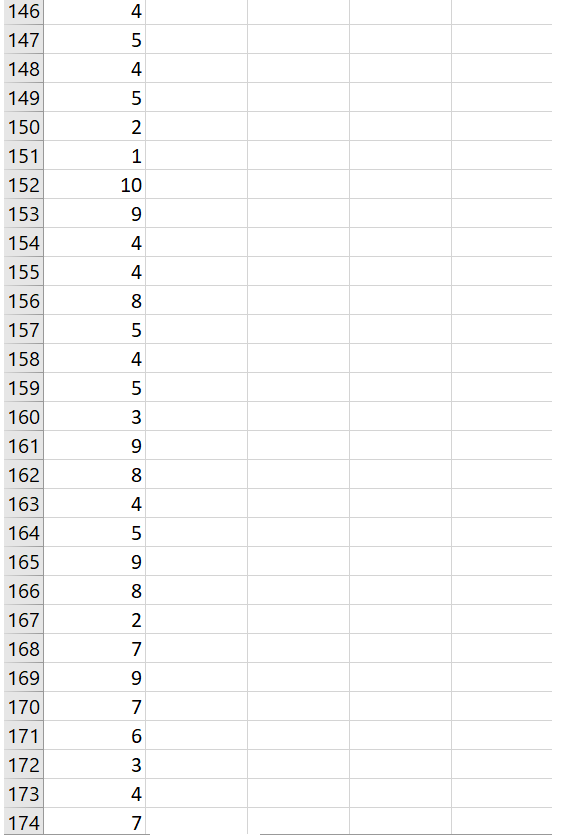
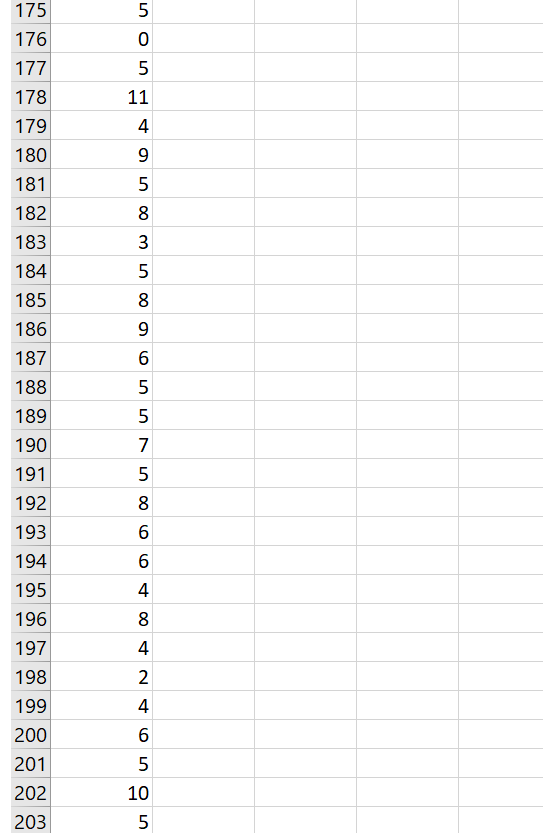
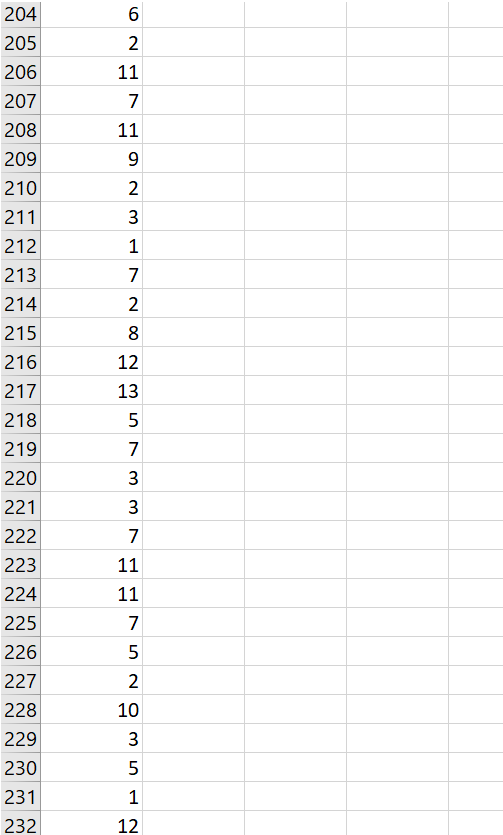
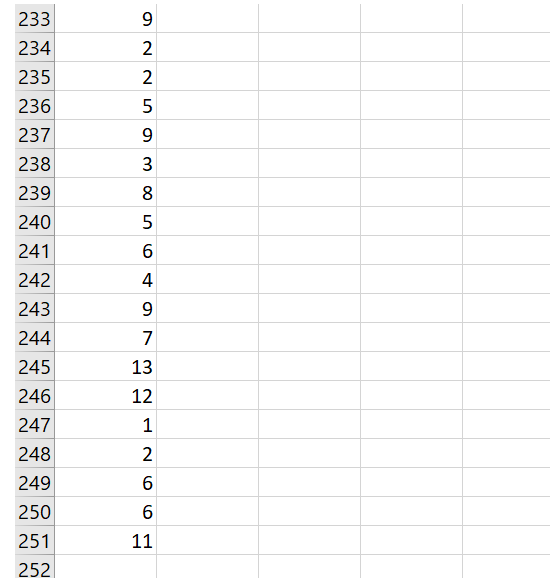
PROBLEM 2: (20 Marks) The Manager of a local Starbuckes Coffee Shop is interested in improving the service provided to customers at the coffee shop. As a first step in the process, the manger asks his assistant to record the number of arrivals between 9:00 A.M and 10:00 A.M., since this is the busiest time of the day. The number of arrivals during this time interval, for a number of days, are included in the excel file titled StarbuckesArrivals_21". This file is posted on Sakai in the Data Folder. Given the background and the data, answer the following questions: a) Use the Excel" spreadsheet application to calculate the average, standard deviation, variance, maximum, minimum, and range for the observations entered in the attached excel file. Interpret these values from a business point of view. In other words, instead of saying 'the variance of the distribution is x.xx', provide a one sentence explanation of the value in non-technical terms, so that someone not familiar with statistical jargon can understand the meaning of the results you have obtained. (4 Marks) b) Develop a frequency chart for the data. Without performing any technical analysis, interpret if the frequency charts resemble any of the probability distributions you learned in this course. Use the Bin Values 1, 3, 6, 9, and 12. (Note: there may be data outside of these range and you are required to handle it accordable.) (5 Marks) c) Do a Chi-Square goodness of fit test to determine if the data, based on the bin values in b above, is from a Poisson distribution. Use a = 0.05 for your test. (6 Marks) d) Assuming that the data does conform to Poisson distribution, what is the probability that there are exactly 3 arrivals between 9:00 A.M and 10:00 A.M.? What is the probability that there are between 2 and 6 arrivals, inclusive, between 9:00 A.M and 10:00 A.M? What is the probability that there are more than 7 arrivals between 9:00 A.M and 10:00 A.M? To solve for the probabilities, use two approaches. First calculate the probabilities using POISSON.DIST excel function, using the sample mean as your estimate for Lambda. Then, solve the probabilities from the data. For the second method, use the observations, and the relative frequencies, which you can find using the Frequency Function with Bin Values of 0, 1, 2,...,7. (5 Marks) E 3 A B C D 1 Number of Arrivals at Starbuckes Coffee Shop 2 5 3 3 4 2 5 7 6 10 7 4 8 5 9 7 10 7 11 7 12 10 13 7 14 6 15 10 16 9 17 5 18 9 19 7 20 9 21 6 22 8 23 5 24 9 25 9 26 3 27 6 28 6 29 8 9 00 00 30 2 11 31 7 32 33 4 6 4 9 34 35 36 4 37 5 38 39 40 41 42 1 4 6 6 7 43 4 10 44 45 3 46 9 47 6 9 5 48 49 50 51 52 10 7 4 3 4 53 54 6 55 4 56 57 58 7 6 2 7 4 6 5 5 4 59 60 61 62 63 64 65 66 67 68 69 70 3 4 8 10 4 4 7 71 9 72 73 74 75 00 5 12 8 5 10 7 12 8 76 8 77 78 79 80 81 82 83 84 85 7 6 2 4 7 86 4 87 5 5 4 4 6 5 88 89 90 91 92 93 94 95 96 97 98 99 100 101 102 4 5 5 103 1 104 105 106 107 6 5 108 7 109 110 111 112 o AN 000 113 114 115 116 N 000 3 117 118 119 120 121 122 123 124 7 4 8 5 2 8 125 126 127 128 129 130 131 5 8 5 132 6 7 133 134 135 136 mm 4 137 6 138 139 10 4 4 5 140 141 142 7 143 5 144 145 4 7 146 4 5 4 147 148 149 150 151 152 N 1 10 9 153 154 4 155 4 156 00 5 157 158 4 5 159 160 161 3 9 162 8 4 5 9 8 8 163 164 165 166 167 168 169 170 2 7 9 7 6 171 3 172 173 174 4 7 175 176 177 178 179 5 11 4 180 9 181 182 183 184 185 186 5 8 3 5 8 9 6 5 187 188 189 190 5 7 191 192 00 6 6 193 194 195 196 4 8 197 4 198 2 4 6 199 200 201 202 203 5 10 6 N 204 205 206 207 208 209 210 211 212 213 214 215 216 217 218 11 7 11 9 2 3 1 7 1 2 00 12 13 5 7 219 220 3 221 3 222 223 7 11 11 7 224 225 5 2 226 227 228 229 2 10 230 5 231 232 1 12 1 9 233 234 235 236 237 238 239 3 8 5 240 6 4 9 7 13 241 242 243 244 245 246 247 248 249 250 251 12 1 N 6 6 11 252


