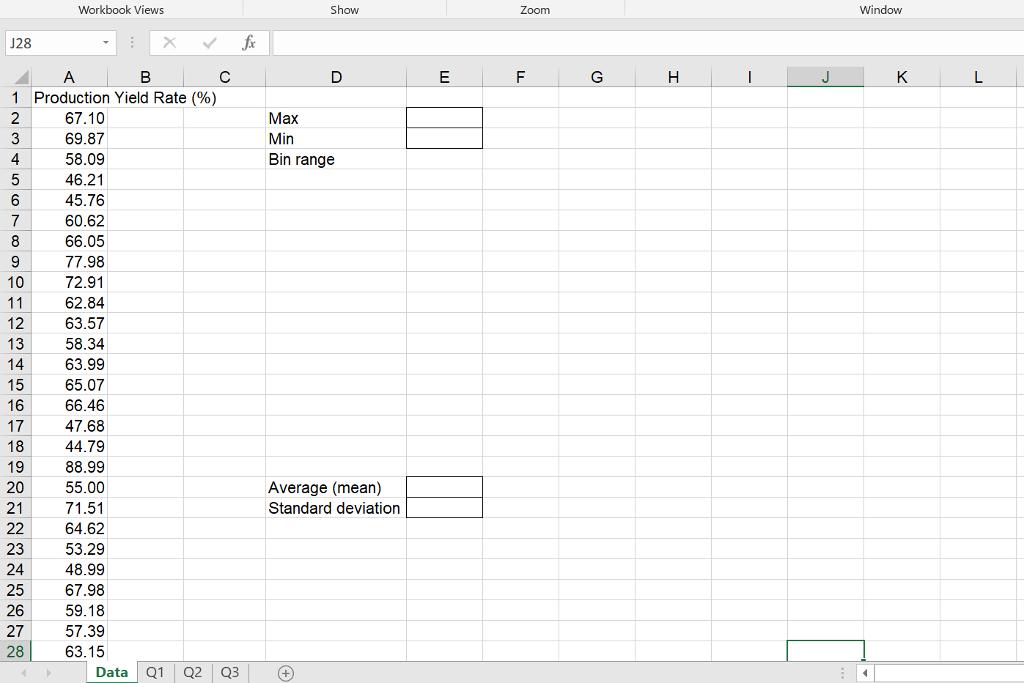
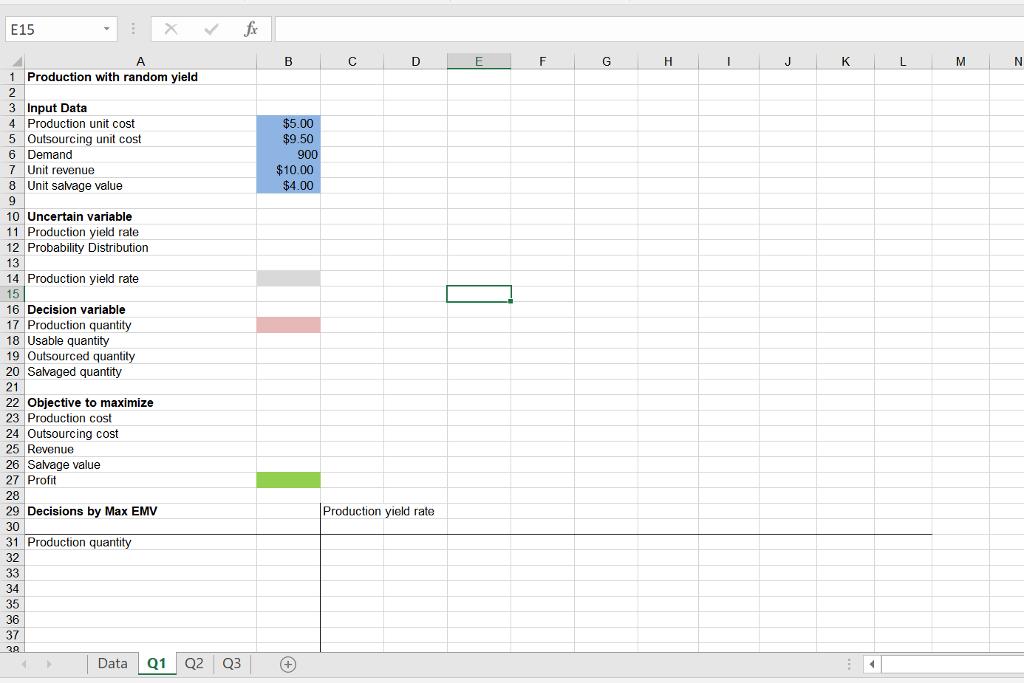
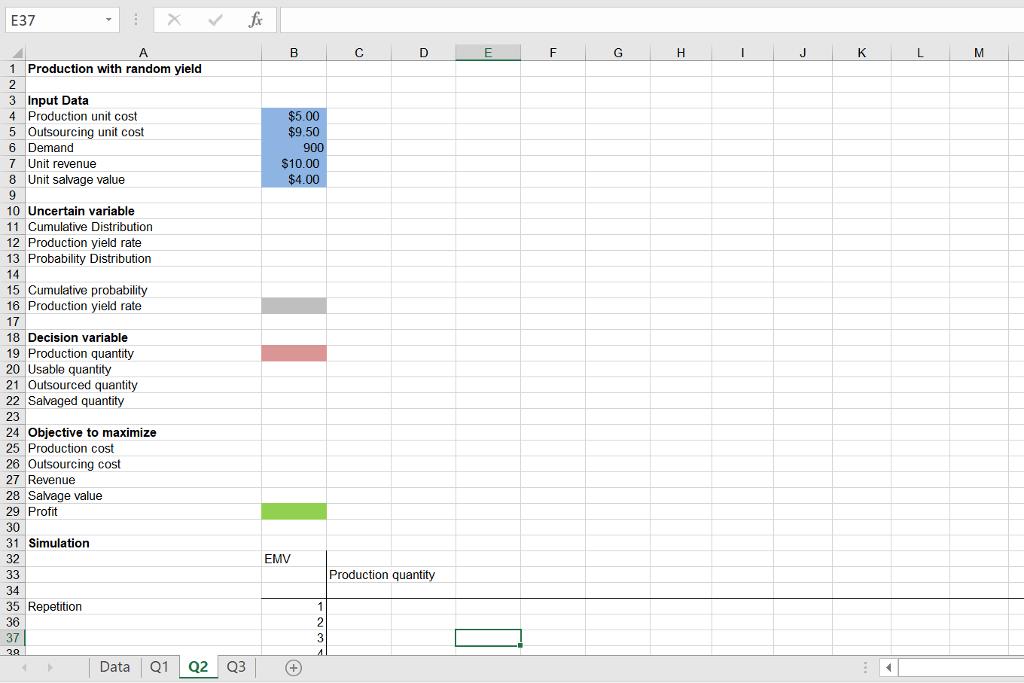
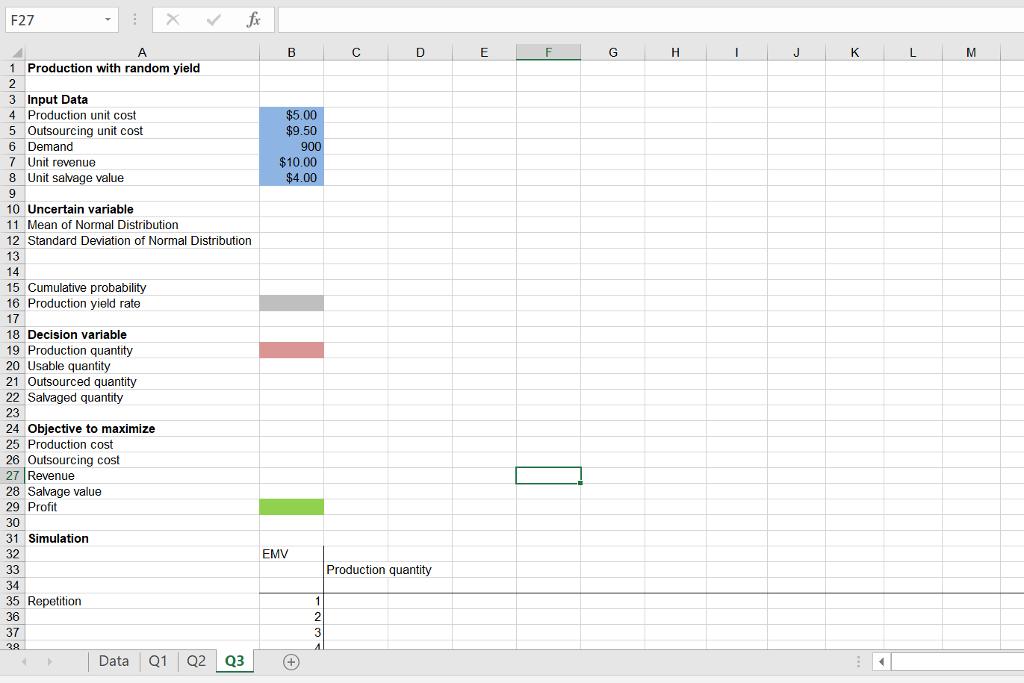
A firm needs to fully satisfy the demand, which is fixed to 900 units and generates unit revenue of $10. However, its production is subject
A firm needs to fully satisfy the demand, which is fixed to 900 units and generates unit revenue of $10. However, its production is subject to the random yield. That is, only a random percentage of production quantity is qualified for demand satisfaction. For each unit that the firm plans to produce, $5 is incurred as the production cost regardless if it can be used or not at the end.
If the qualified final output from the production is less than the demand, the firm has to outsource from a more expensive source to cover the gap. The corresponding cost is $9.5 per unit. If the qualified output is more than the demand, the firm can salvage the leftover at the unit price of $4.
The firm has the historical data on the production yield rate, which can be used to estimate the distribution of the random yield rate.
Please answer the following questions and show formulas in excel for the solutions:
1.Use the Histogram to estimate the probability distribution of random yield rate. Use the estimated production yield rate probability distribution, set up the model and determine the production quantity based on EMV criterion.
2,Use the estimated production yield rate probability distribution to set up the simulation model and determine the production quantity based on EMV criterion.
3.Assume the production yield rate satisfying the Normal Distribution. Use the Descriptive Statistics to estimate its Normal Distribution. Use the estimated Normal distribution to set up the simulation model and determine the production quantity based on EMV criterion.
Data:


Workbook Views Show Zoom Window J28 fx A C D E G H J. K L 1 Production Yield Rate (%) 67.10 2 x 69.87 Min 4 58.09 Bin range 46.21 6. 45.76 7 60.62 66.05 9 77.98 10 72.91 11 62.84 12 63.57 13 58.34 14 63.99 15 65.07 16 66.46 17 47.68 18 44.79 19 88.99 Average (mean) Standard deviation 20 55.00 21 71.51 22 64.62 23 53.29 24 48.99 25 67.98 26 59.18 27 57.39 28 63.15 Data Q1 Q2 Q3
Step by Step Solution
3.29 Rating (161 Votes )
There are 3 Steps involved in it
Step: 1

See step-by-step solutions with expert insights and AI powered tools for academic success
Step: 2

Step: 3

Ace Your Homework with AI
Get the answers you need in no time with our AI-driven, step-by-step assistance
Get Started


