Answered step by step
Verified Expert Solution
Link Copied!

Question

1 Approved Answer

Problem 2. (40 points) Historical data of the returns for Goodman and Landry is given in the table below. 2013 2012 2011 2010 2009 Goodman
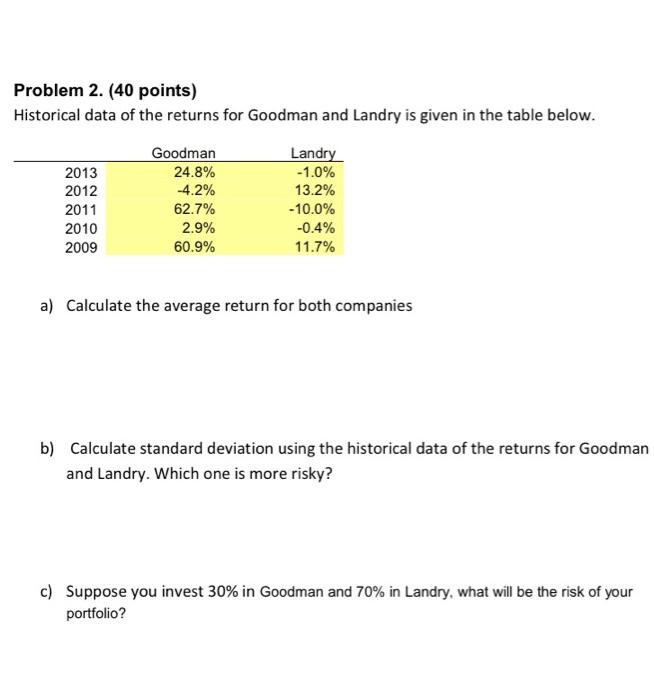
image text in transcribed
Problem 2. (40 points) Historical data of the returns for Goodman and Landry is given in the table below. 2013 2012 2011 2010 2009 Goodman 24.8% -4.2% 62.7% 2.9% 60.9% Landry -1.0% 13.2% - 10.0% -0.4% 11.7% a) Calculate the average return for both companies b) Calculate standard deviation using the historical data of the returns for Goodman and Landry. Which one is more risky? c) Suppose you invest 30% in Goodman and 70% in Landry, what will be the risk of your portfolio

Step by Step Solution

There are 3 Steps involved in it

Step: 1

blur-text-image

Get Instant Access to Expert-Tailored Solutions

See step-by-step solutions with expert insights and AI powered tools for academic success

Step: 2

blur-text-image_2

Step: 3

blur-text-image_3

Ace Your Homework with AI

Get the answers you need in no time with our AI-driven, step-by-step assistance

Get Started

Recommended Textbook for

Personal Finance Terms Financial Education Is Your Best Investment

Authors: Thomas Herold

1st Edition

1090822871, 978-1090822871

More Books

Students also viewed these Finance questions

Question

a neglect of quality in relationship to international competitors;

Answered: 1 week ago