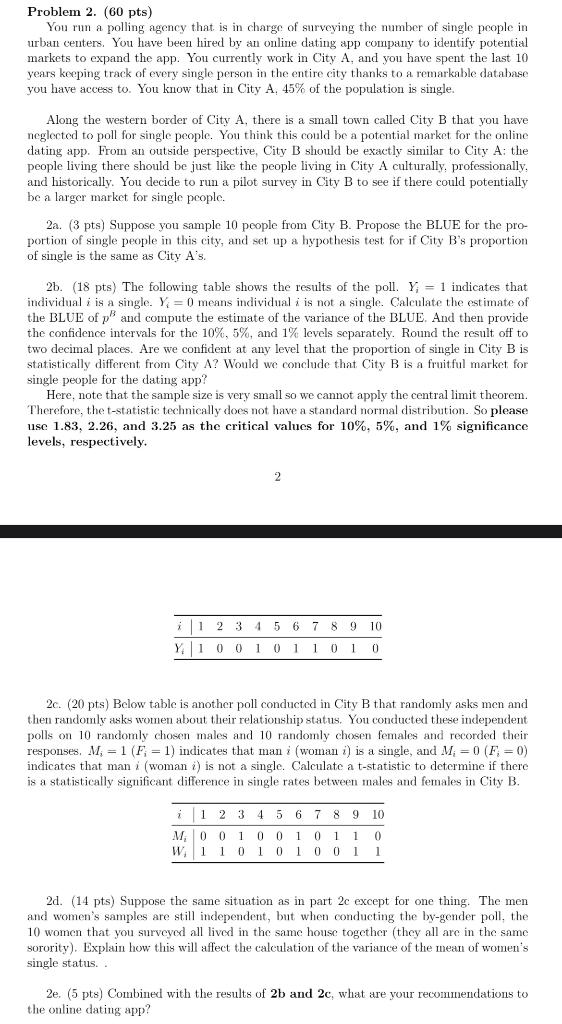
Problem 2. (60 pts) You run a polling agency that is in charge of surveying the number of single people in urban centers. You have been hired by an online dating app company to identify potential markets to expand the app. You currently work in City A, and you have spent the last 10 years keeping track of every single person in the entire city thanks to a remarkable database you have access to. You know that in City A, 45% of the population is single. Along the western border of City A, there is a small town called City B that you have neglected to poll for single people. You think this could be a potential market for the online dating app. From an outside perspective, City B should be exactly similar to City A: the people living there should be just like the people living in City A culturally, professionally, and historically. You decide to run a pilot survey in City B to see if there could potentially be a larger market for single people. 2a. (3 pts) Suppose you sample 10 people from City B. Propose the BLUE for the proportion of single people in this city, and set up a hypothesis test for if City B's proportion of single is the same as City A's. 2b. (18 pts) The following table shows the results of the poll. Yi=1 indicates that individual i is a single. Yi=0 means individual i is not a single. Calculate the estimate of the BLUE of pB and compute the estimate of the variance of the BLUE. And then provide the confidence intervals for the 10%,5%, and 1% levels separately. Round the result off to two decimal places. Are we confident at any level that the proportion of single in City B is statistically different from City A ? Would we conclude that. City B is a fruitful market for single people for the dating app? Here, note that the sample size is very small so we cannot apply the central limit theorem. Therefore, the t-statistic technically does not have a standard normal distribution. So please use 1.83,2.26, and 3.25 as the critical values for 10%,5%, and 1% significance levels, respectively. 2 2c. (20 pts) Below table is another poll conducted in City B that randomly asks men and then randomly asks women about their relationship status. You conducted these independent polls on 10 randomly chosen males and 10 randomly chosen females and recorded their responses. Mi=1(Fi=1) indicates that man i( woman i) is a single, and Mi=0(Fi=0) indicates that man i (woman i ) is not a single. Calculate a t-statistic to determine if there is a statistically significant difference in single rates between males and females in City B. 2d. (14 pts) Suppose the same situation as in part 2c except for one thing. The men and women's samples are still independent, but when conducting the by-gender poll, the 10 women that you surveyed all lived in the same house together (they all are in the same sorority). Explain how this will affect the calculation of the variance of the mean of women's single status. . 2e, (5 pts) Combined with the results of 2b and 2c, what are your recommendations to the online dating app? Problem 2. (60 pts) You run a polling agency that is in charge of surveying the number of single people in urban centers. You have been hired by an online dating app company to identify potential markets to expand the app. You currently work in City A, and you have spent the last 10 years keeping track of every single person in the entire city thanks to a remarkable database you have access to. You know that in City A, 45% of the population is single. Along the western border of City A, there is a small town called City B that you have neglected to poll for single people. You think this could be a potential market for the online dating app. From an outside perspective, City B should be exactly similar to City A: the people living there should be just like the people living in City A culturally, professionally, and historically. You decide to run a pilot survey in City B to see if there could potentially be a larger market for single people. 2a. (3 pts) Suppose you sample 10 people from City B. Propose the BLUE for the proportion of single people in this city, and set up a hypothesis test for if City B's proportion of single is the same as City A's. 2b. (18 pts) The following table shows the results of the poll. Yi=1 indicates that individual i is a single. Yi=0 means individual i is not a single. Calculate the estimate of the BLUE of pB and compute the estimate of the variance of the BLUE. And then provide the confidence intervals for the 10%,5%, and 1% levels separately. Round the result off to two decimal places. Are we confident at any level that the proportion of single in City B is statistically different from City A ? Would we conclude that. City B is a fruitful market for single people for the dating app? Here, note that the sample size is very small so we cannot apply the central limit theorem. Therefore, the t-statistic technically does not have a standard normal distribution. So please use 1.83,2.26, and 3.25 as the critical values for 10%,5%, and 1% significance levels, respectively. 2 2c. (20 pts) Below table is another poll conducted in City B that randomly asks men and then randomly asks women about their relationship status. You conducted these independent polls on 10 randomly chosen males and 10 randomly chosen females and recorded their responses. Mi=1(Fi=1) indicates that man i( woman i) is a single, and Mi=0(Fi=0) indicates that man i (woman i ) is not a single. Calculate a t-statistic to determine if there is a statistically significant difference in single rates between males and females in City B. 2d. (14 pts) Suppose the same situation as in part 2c except for one thing. The men and women's samples are still independent, but when conducting the by-gender poll, the 10 women that you surveyed all lived in the same house together (they all are in the same sorority). Explain how this will affect the calculation of the variance of the mean of women's single status. . 2e, (5 pts) Combined with the results of 2b and 2c, what are your recommendations to the online dating app


