

Answered step by step
Verified Expert Solution
Question
1 Approved Answer
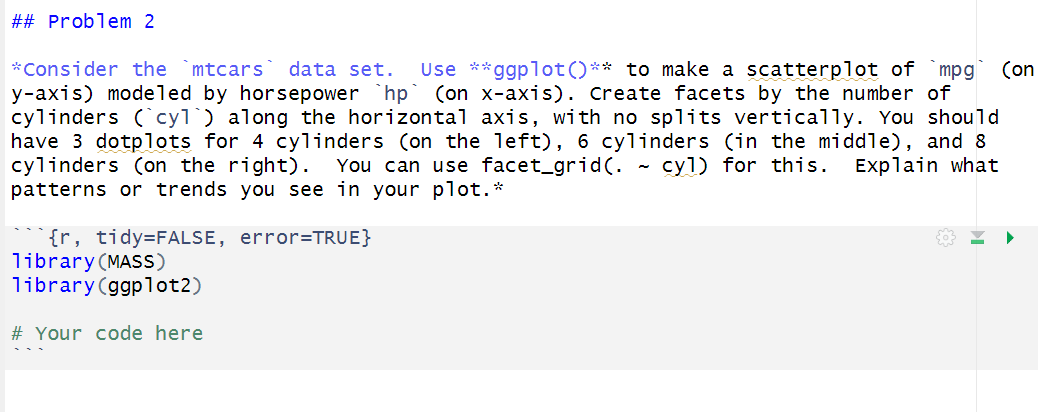
## Problem 2 Consider the mtcars' data set. Use Nggplot ( ) * to make a scatterplot of mpg y - axis )
## Problem
"Consider the "mtcars' data set. Use "Nggplot to make a scatterplot of mpg
yaxis modeled by horsepower hpon xaxis Create facets by the number of
cylinders along the horizontal axis, with no splits vertically. You should
have dotplots for cylinders on the left cylinders in the middle and
cylinders on the right You can use facetgrid cyl for this. Explain what
patterns or trends you see in your plot.
tidyFALSE, errorTRUE
Step by Step Solution
There are 3 Steps involved in it
Step: 1

Get Instant Access to Expert-Tailored Solutions
See step-by-step solutions with expert insights and AI powered tools for academic success
Step: 2

Step: 3
Ace Your Homework with AI
Get the answers you need in no time with our AI-driven, step-by-step assistance
Get Started
Machine Learning And Knowledge Discovery In Databases European Conference Ecml Pkdd 2014 Nancy France September 15 19 2014 Proceedings Part I Lnai 8724
Authors: Toon Calders ,Floriana Esposito ,Eyke Hullermeier ,Rosa Meo
2014th Edition