Answered step by step
Verified Expert Solution
Link Copied!

Question

1 Approved Answer

Problem #2: data file: https://docs.google.com/spreadsheets/d/1gji16GfWU8HrvINmLqBtZJUDZttV0c6ulmWQBUYEIJw/edit?usp=sharing Problem 2: Human Development Index This question asks you to empirically explore the strength of the relationship between income per

Problem #2:

data file: https://docs.google.com/spreadsheets/d/1gji16GfWU8HrvINmLqBtZJUDZttV0c6ulmWQBUYEIJw/edit?usp=sharing
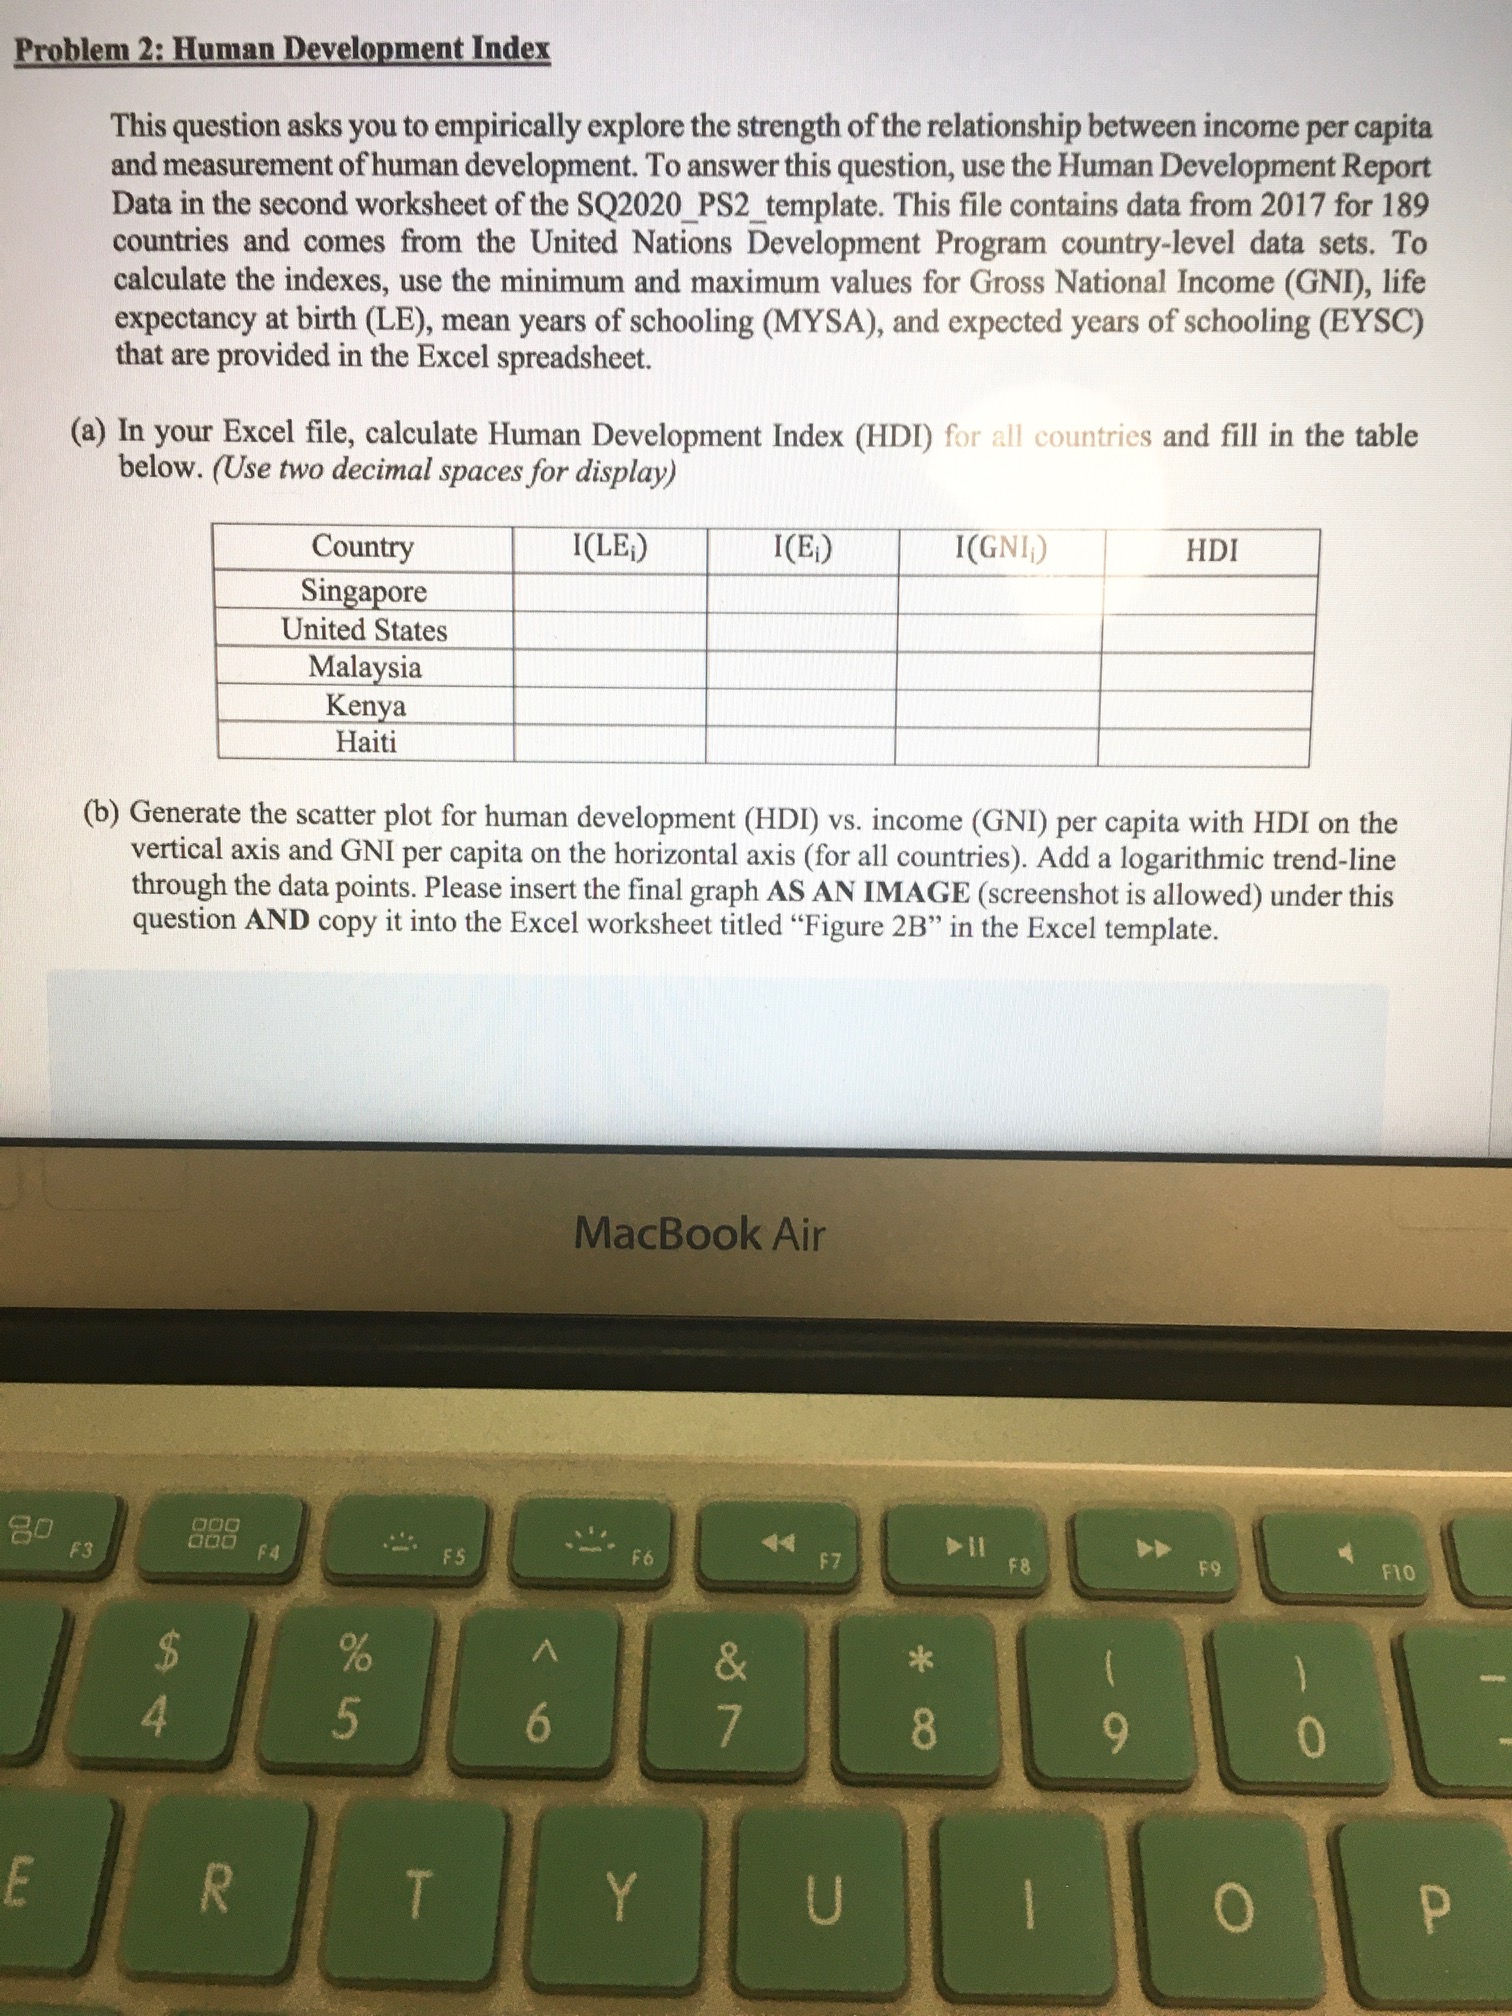
image text in transcribedimage text in transcribed
Problem 2: Human Development Index This question asks you to empirically explore the strength of the relationship between income per capita and measurement of human development. To answer this question, use the Human Development Report Data in the second worksheet of the SQ2020_PS2_template. This file contains data from 2017 for 189 countries and comes from the United Nations Development Program country-level data sets. To calculate the indexes, use the minimum and maximum values for Gross National Income (GNI), life expectancy at birth (LE), mean years of schooling (MYSA), and expected years of schooling (EYSC) that are provided in the Excel spreadsheet. (a) In your Excel file, calculate Human Development Index (HDI) for all countries and fill in the table below. (Use two decimal spaces for display) Country I(LE;) I(E;) I(GNI,) HDI Singapore United States Malaysia Kenya Haiti (b) Generate the scatter plot for human development (HDI) vs. income (GNI) per capita with HDI on the vertical axis and GNI per capita on the horizontal axis (for all countries). Add a logarithmic trend-line through the data points. Please insert the final graph AS AN IMAGE (screenshot is allowed) under this question AND copy it into the Excel worksheet titled "Figure 2B" in the Excel template. MacBook Air 30 F3 F4 FS F6 44 $7 F8 FO F10 > OO O R Y U O(c) In a few sentences, discuss the relationship between income per capita and HDI. Do you conclude that higher income per capita leads to better performance in terms of the human development indicator? Is the relationship strong? Do you notice any outliers? MacBook Air 44 F3 F6 F7 F8 F10 F4 F5 LA UT de 8 O 70

Step by Step Solution

There are 3 Steps involved in it

Step: 1

blur-text-image

Get Instant Access to Expert-Tailored Solutions

See step-by-step solutions with expert insights and AI powered tools for academic success

Step: 2

blur-text-image

Step: 3

blur-text-image

Ace Your Homework with AI

Get the answers you need in no time with our AI-driven, step-by-step assistance

Get Started

Recommended Textbook for

Intermediate Microeconomics and Its Application

Authors: walter nicholson, christopher snyder

11th edition

9781111784300, 324599102, 1111784302, 978-0324599107

More Books

Students also viewed these Economics questions

Question

=+a. What is GDP in this economy? Explain.

Answered: 1 week ago