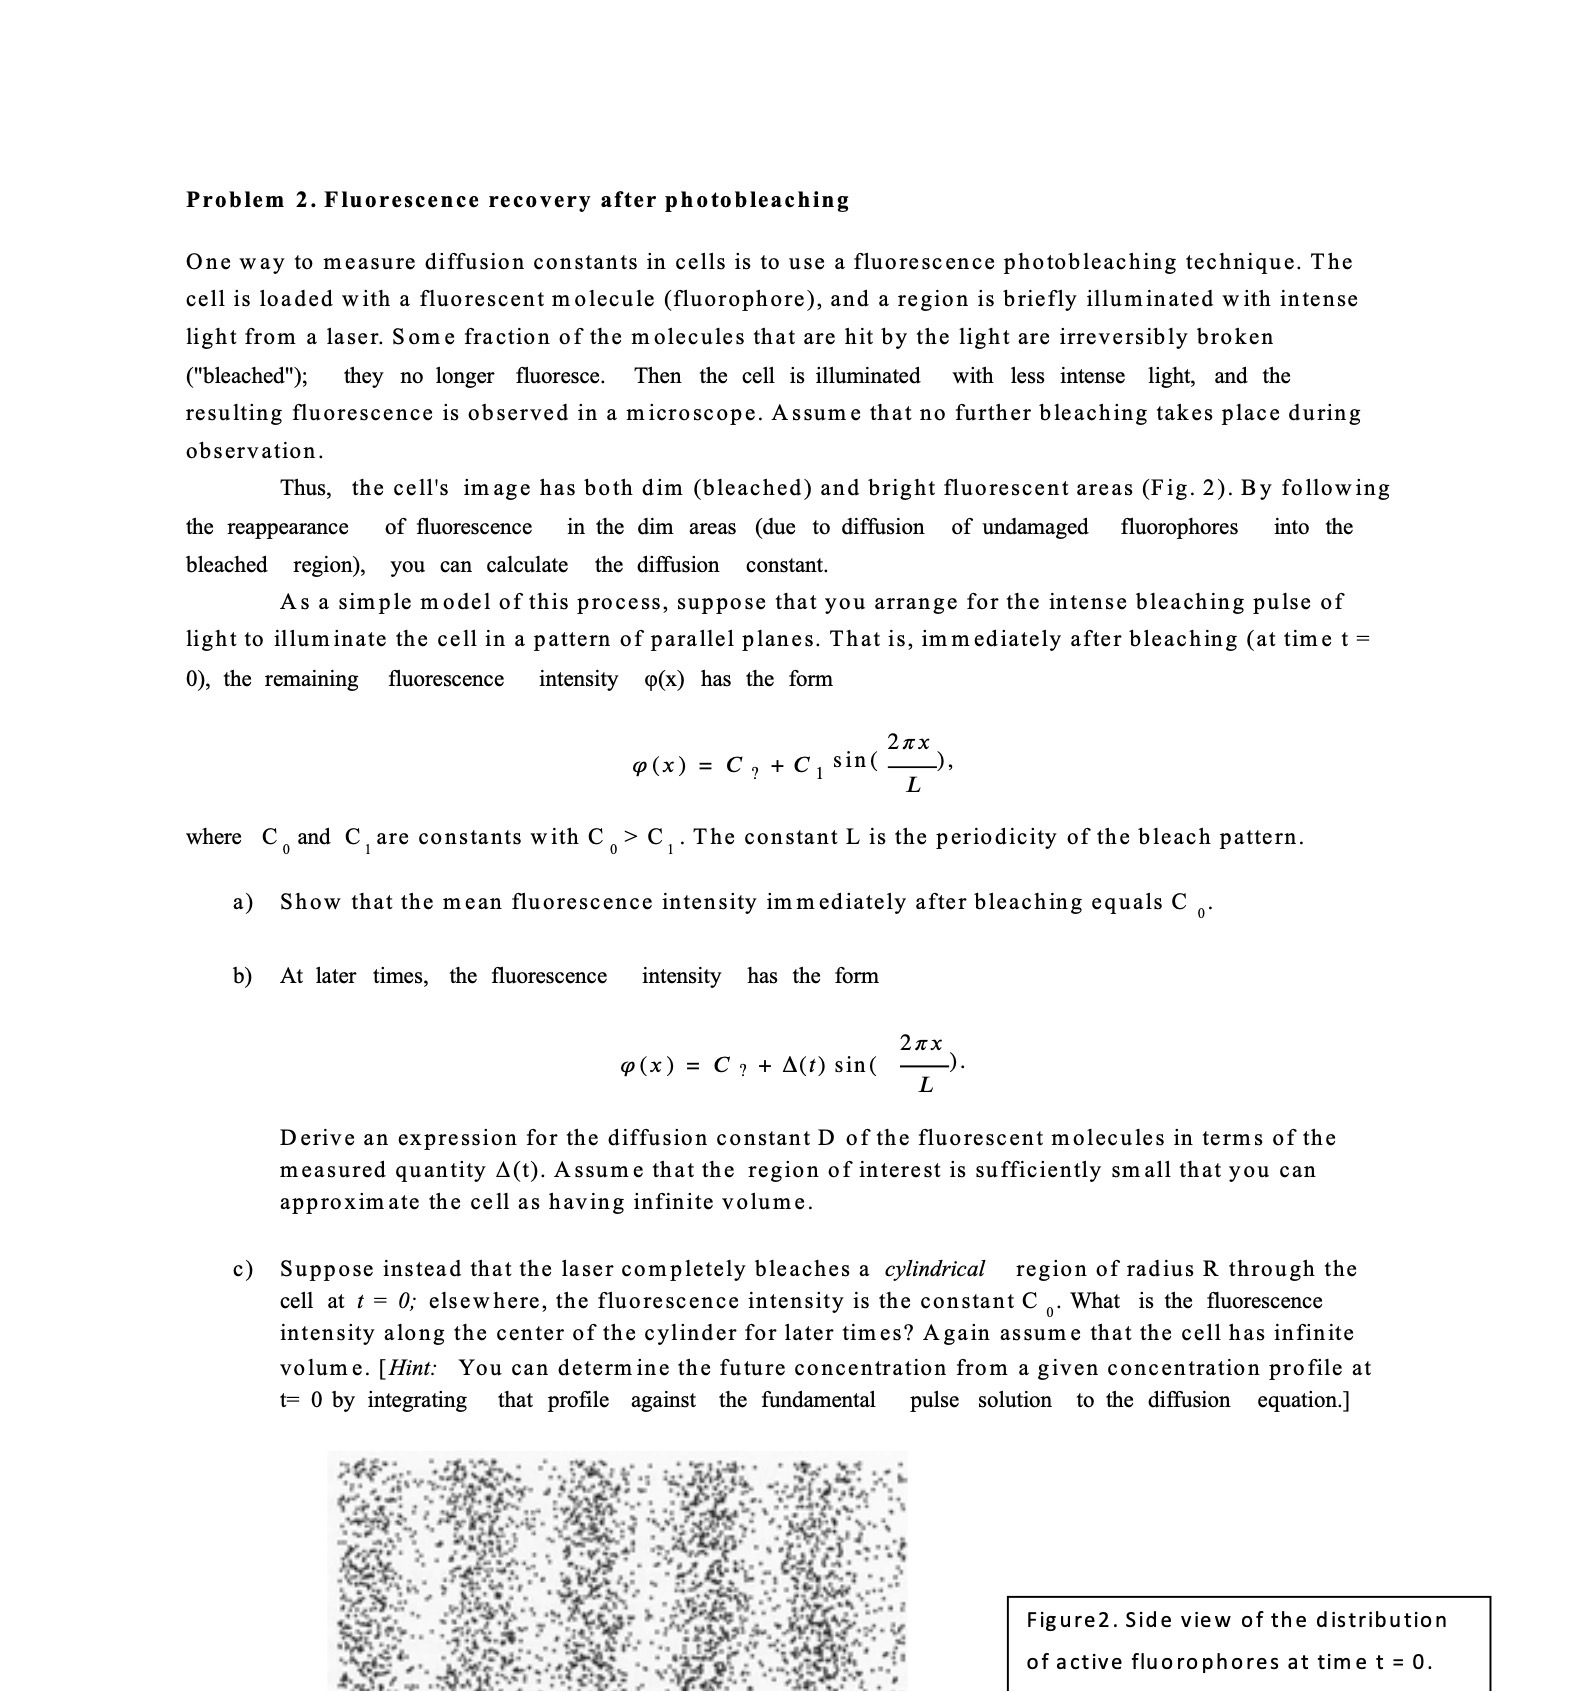
Problem 2. Fluorescence recovery after photobleaching One way to measure diffusion constants in cells is to use a fluorescence photobleaching technique. The cell is loaded with a fluorescent molecule (fluorophore), and a region is briefly illuminated with intense light from a laser. Some fraction of the molecules that are hit by the light are irreversibly broken ("bleached"); they no longer fluoresce. Then the cell is illuminated with less intense light, and the resulting fluorescence is observed in a microscope. Assume that no further bleaching takes place during observation. Thus, the cell's image has both dim (bleached) and bright fluorescent areas (Fig. 2). By following the reappearance of fluorescence in the dim areas (due to diffusion of undamaged fluorophores into the bleached region), you can calculate the diffusion constant. As a simple model of this process, suppose that you arrange for the intense bleaching pulse of light to illuminate the cell in a pattern of parallel planes. That is, immediately after bleaching (at time t = 0), the remaining fluorescence intensity (x) has the form p (x) = C, + C, sin( 2xX where C and C are constants with C. > C . The constant L is the periodicity of the bleach pattern. Show that the mean fluorescence intensity immediately after bleaching equals C ,. b) At later times, the fluorescence intensity has the form (x) = C , + A(t) sin( 2 xX L Derive an expression for the diffusion constant D of the fluorescent molecules in terms of the measured quantity A(t). Assume that the region of interest is sufficiently small that you can approximate the cell as having infinite volume. c) Suppose instead that the laser completely bleaches a cylindrical region of radius R through the cell at t = 0; elsewhere, the fluorescence intensity is the constant C . What is the fluorescence intensity along the center of the cylinder for later times? Again assume that the cell has infinite volume. [Hint: You can determine the future concentration from a given concentration profile at t= 0 by integrating that profile against the fundamental pulse solution to the diffusion equation.] Figure2. Side view of the distribution of active fluorophores at time t = 0


