

Answered step by step
Verified Expert Solution
Question
1 Approved Answer
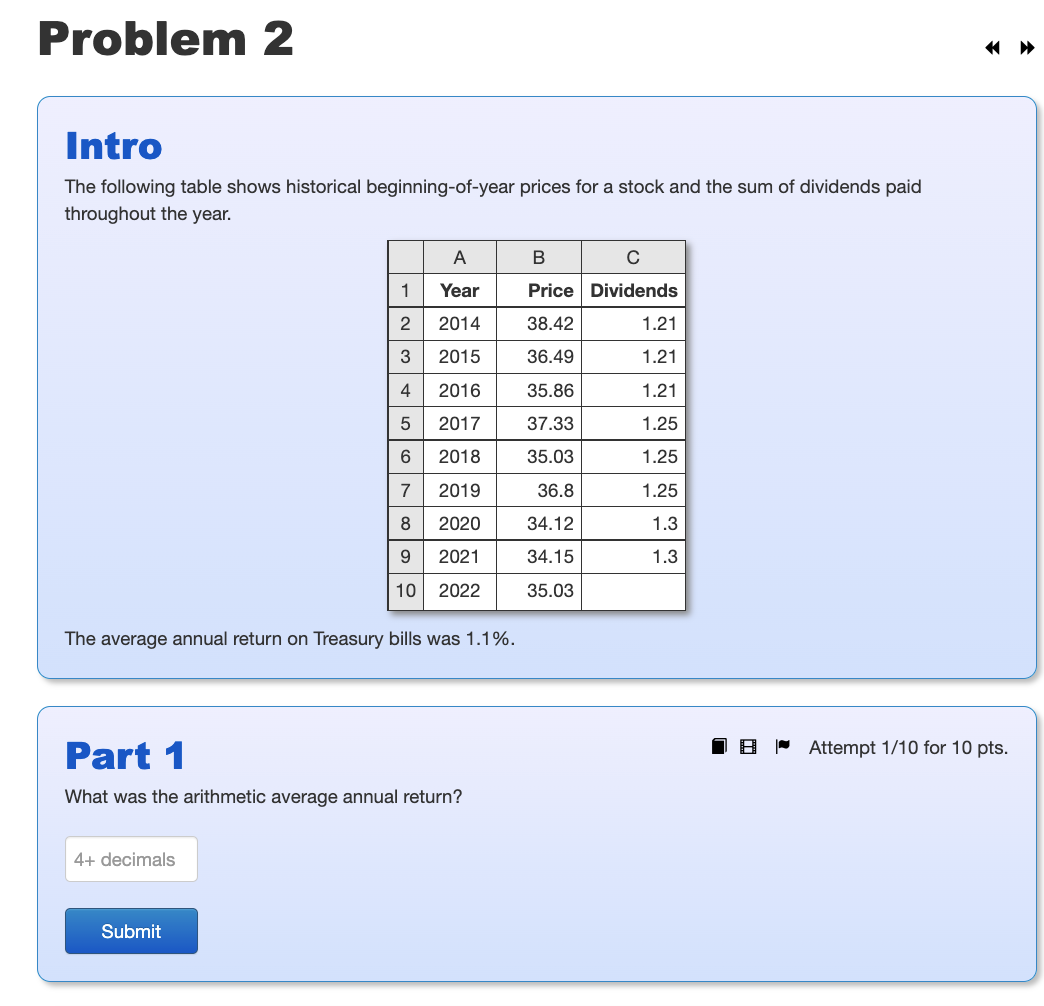
Problem 2 Intro The following table shows historical beginning-of-year prices for a stock and the sum of dividends paid throughout the year. A B 1
Step by Step Solution
There are 3 Steps involved in it
Step: 1

Get Instant Access to Expert-Tailored Solutions
See step-by-step solutions with expert insights and AI powered tools for academic success
Step: 2

Step: 3
Ace Your Homework with AI
Get the answers you need in no time with our AI-driven, step-by-step assistance
Get Started
Financial Management Concepts and Applications
Authors: Stephen Foerster
1st edition
013293664X, 978-0132936644