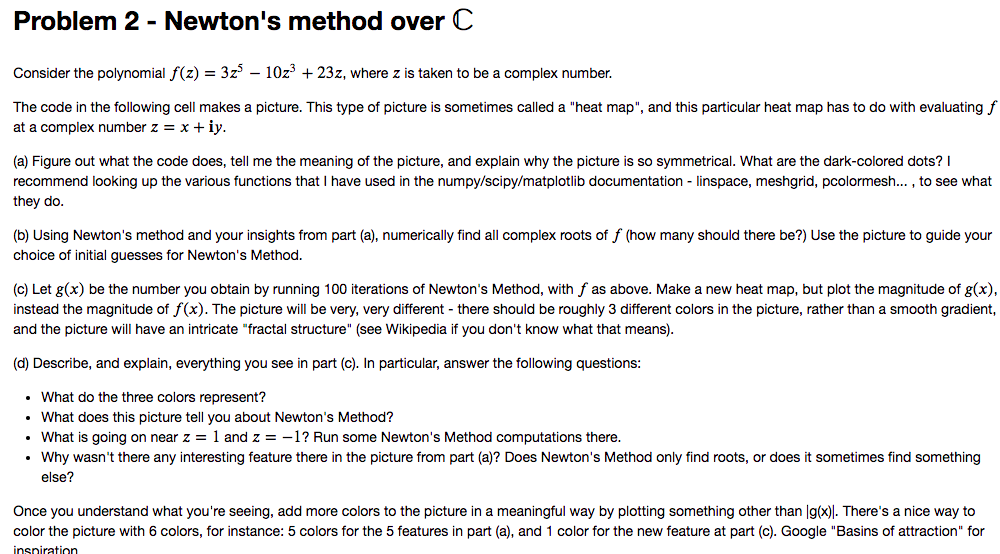
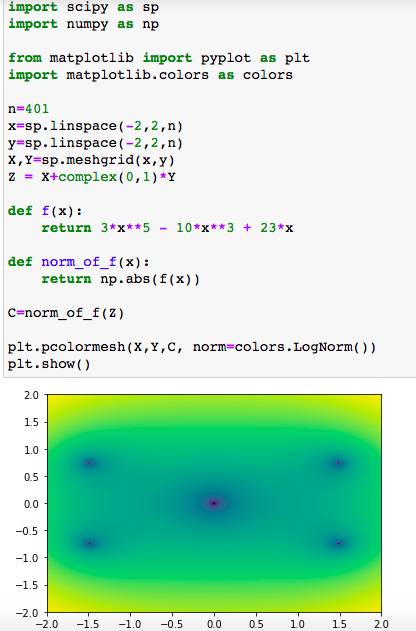
Problem 2 - Newton's method over Consider the polynomial f(z) = 3z5 10z3 + 23z, where z is taken to be a complex number. The code in the following cell makes a picture. This type of picture is sometimes called a "heat map", and this particular heat map has to do with evaluating f at a complex number z = x + iy. (a) Figure out what the code does, tell me the meaning of the picture, and explain why the picture is so symmetrical. What are the dark-colored dots? I recommend looking up the various functions that I have used in the numpy/scipy/matplotlib documentation - linspace, meshgrid, pcolormesh..., to see what they do. (b) Using Newton's method and your insights from part (a), numerically find all complex roots of f (how many should there be?) Use the picture to guide your choice of initial guesses for Newton's Method. (c) Let g(x) be the number you obtain by running 100 iterations of Newton's Method, with f as above. Make a new heat map, but plot the magnitude of g(x), instead the magnitude of f(x). The picture will be very, very different - there should be roughly 3 different colors in the picture, rather than a smooth gradient, and the picture will have an intricate "fractal structure" (see Wikipedia if you don't know what that means). (d) Describe, and explain, everything you see in part (c). In particular, answer the following questions: What do the three colors represent? What does this picture tell you about Newton's Method? What is going on near z = 1 and 2 = -1? Run some Newton's Method computations there. Why wasn't there any interesting feature there in the picture from part (a)? Does Newton's Method only find roots, or does it sometimes find something else? Once you understand what you're seeing, add more colors to the picture in a meaningful way by plotting something other than g(x)]. There's a nice way to color the picture with 6 colors, for instance: 5 colors for the 5 features in part (a), and 1 color for the new feature at part (C). Google "Basins of attraction" for insniration import scipy as sp import numpy as np from matplotlib import pyplot as plt import matplotlib.colors as colors n=401 x=sp.linspace(-2,2,n) y=sp.linspace(-2,2,n) X, Y=sp.meshgrid(x,y) Z = X+complex(0,1)*Y def f(x): return 3****5 - 10****3 + 23*X def norm_of_f(x): return np.abs(f(x)) C=norm_of_f(2) plt.pcolormesh(x,y,c, norm=colors. LogNorm()) plt.show() 2.0 15 10 0.5 0.0 -0.5 -1.0 -1.5 -2.0 -2.0 -1.5 -1.0 -0.5 0.0 0.5 1.0 1 5 1.5 2.0