Answered step by step
Verified Expert Solution
Link Copied!

Question

1 Approved Answer

Problem 2 The following diagram represents the experimental data of the mixture ethane (1) - decane (2) at two temperatures: T-511K (red circles) and T-411K
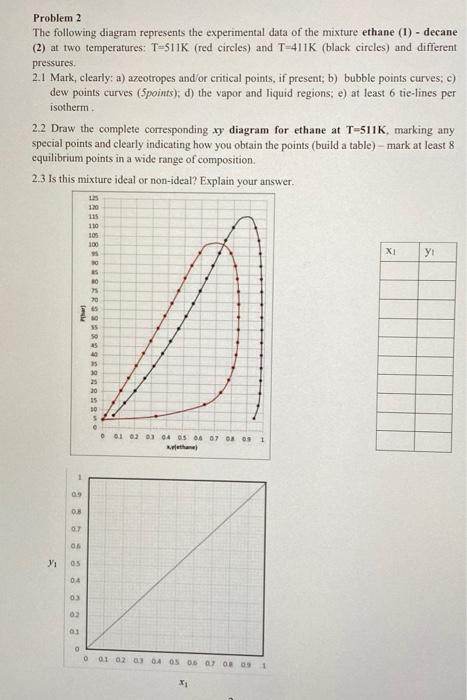
image text in transcribed
Problem 2 The following diagram represents the experimental data of the mixture ethane (1) - decane (2) at two temperatures: T-511K (red circles) and T-411K (black circles) and different pressures. 2.1 Mark, clearly: a) azeotropes and/or critical points, if present; b) bubble points curves, c) dew points curves (Spoints); d) the vapor and liquid regions; e) at least 6 tie-lines per isotherm 2.2 Draw the complete corresponding xy diagram for ethane at T-511K, marking any special points and clearly indicating how you obtain the points (build a table) - mark at least 8 equilibrium points in a wide range of composition 2.3 Is this mixture ideal or non-ideal? Explain your answer. 25 120 125 110 105 100 X 0 BS 30 75 0 Phar 35 50 35 25 10 25 20 35 30 5 0 01 02 03 04 05 06 07 08 09 1 thane 1 09 08 05 eeee 04 03 O 0 01 02 03 04 05 06 07 08 09 1 X

Step by Step Solution

There are 3 Steps involved in it

Step: 1

blur-text-image

Get Instant Access to Expert-Tailored Solutions

See step-by-step solutions with expert insights and AI powered tools for academic success

Step: 2

blur-text-image

Step: 3

blur-text-image

Ace Your Homework with AI

Get the answers you need in no time with our AI-driven, step-by-step assistance

Get Started

Recommended Textbook for

Product And Process Design Principles Synthesis Analysis And Evaluation

Authors: Warren D. Seider, Daniel R. Lewin, J. D. Seader, Soemantri Widagdo, Rafiqul Gani, Ka Ming Ng

4th Edition

1119355249, 978-1119355243

More Books

Students also viewed these Chemical Engineering questions