Problem 2:
You are given three companies, General Motors (GM), Renault (RNO) and Toyota Motors (TM) and you are asked to assess their valuation and the opportunity to combine those shares in the same portfolio.
1) If the actual return on GM share will be 12%, would the price of the share be undervalued or overvalued?
2) Compute the expected return of the portfolios:
1. P1 combining 50% of GM and 50% of RNO.
2. P2 combining 50% of GM and 50% of TM.
Use the expected returns computed in the question 14. Show your calculations. Compute the variance and standard deviation of your portfolios P1 and P2. Show your calculations. Does it provide a good diversification?
3) Which portfolio, if you consider P1 and P2, provides the best diversification? What indicator do you need to compute to be able to compare the two portfolios? Do your results confirm the intuition you should have had with the correlation coefficient? Why?
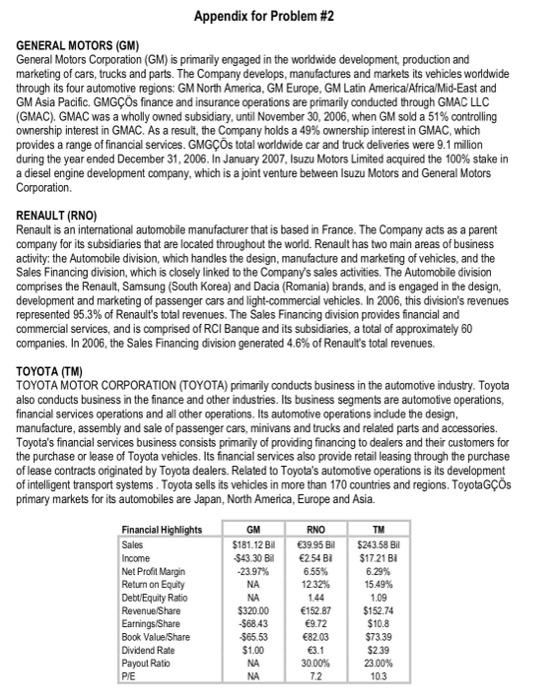
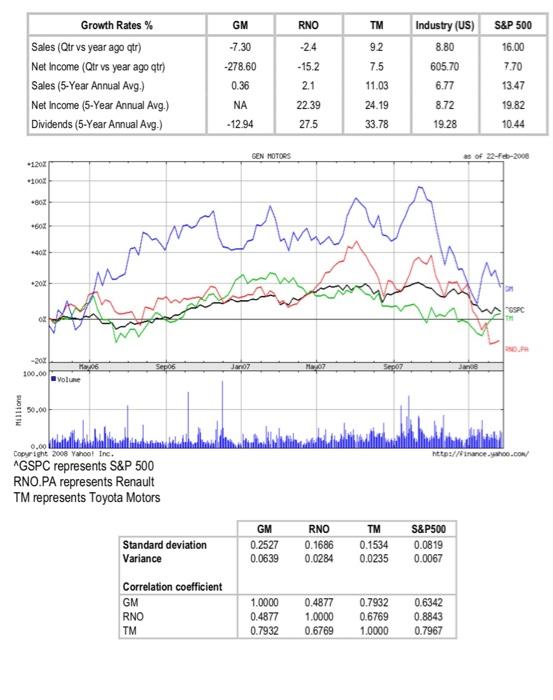
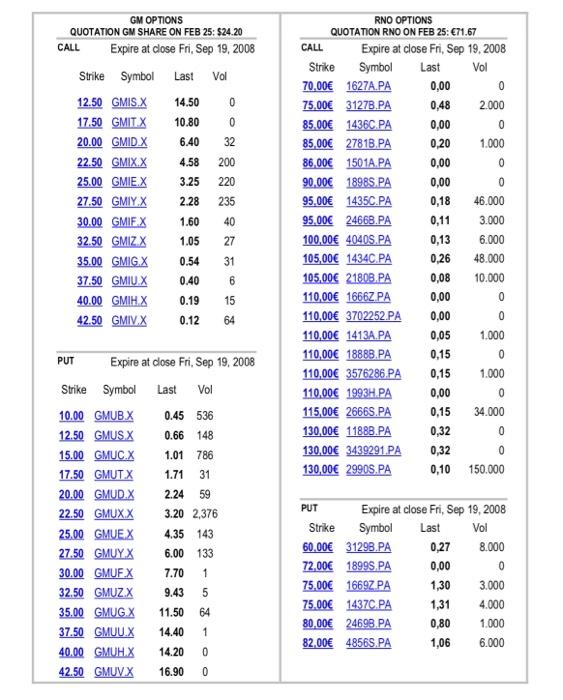
Appendix for Problem #2 GENERAL MOTORS (GM) General Motors Corporation (GM) is primarily engaged in the worldwide development production and marketing of cars, trucks and parts. The Company develops, manufactures and markets its vehicles worldwide through its four automotive regions: GM North America, GM Europe, GM Latin America/Africa/Mid-East and GM Asia Pacific. GMGs finance and insurance operations are primarily conducted through GMAC LLC (GMAC). GMAC was a wholly owned subsidiary, until November 30, 2006, when GM sold a 51% controlling ownership interest in GMAC. As a result, the Company holds a 49% ownership interest in GMAC, which provides a range of financial services. GMGs total worldwide car and truck deliveries were 9.1 million during the year ended December 31, 2006. In January 2007, Isuzu Motors Limited acquired the 100% stake in a diesel engine development company, which is a joint venture between Isuzu Motors and General Motors Corporation RENAULT (RNO) Renault is an international automobile manufacturer that is based in France. The Company acts as a parent company for its subsidiaries that are located throughout the world. Renault has two main areas of business activity: the Automobile division, which handles the design, manufacture and marketing of vehicles, and the Sales Financing division, which is closely linked to the Company's sales activities. The Automobile division comprises the Renault, Samsung (South Korea) and Dacia (Romania) brands, and is engaged in the design, development and marketing of passenger cars and light-commercial vehicles. In 2006, this division's revenues represented 95.3% of Renault's total revenues. The Sales Financing division provides financial and commercial services, and is comprised of RCI Banque and its subsidiaries, a total of approximately 60 companies. In 2006, the Sales Financing division generated 4.6% of Renault's total revenues. TOYOTA (TM) TOYOTA MOTOR CORPORATION (TOYOTA) primarily conducts business in the automotive industry. Toyota also conducts business in the finance and other industries. Its business segments are automotive operations, financial services operations and all other operations, its automotive operations include the design manufacture, assembly and sale of passenger cars, minivans and trucks and related parts and accessories. Toyota's financial services business consists primarily of providing financing to dealers and their customers for the purchase or lease of Toyota vehicles. Its financial services also provide retail leasing through the purchase of lease contracts onginated by Toyota dealers. Related to Toyota's automotive operations is its development of intelligent transport systems. Toyota sells its vehicles in more than 170 countries and regions. Toyota os primary markets for its automobiles are Japan, North America, Europe and Asia. Financial Highlights Sales Income Net Profil Margin Return on Equity Debt/Equity Ratio Revenue/Share Earnings/Share Book ValueShare Dividend Rate Payout Ratio PE GM $181.12 B $43.30 B -23.97% NA NA $320.00 -568.43 $65.53 $1.00 NA NA RNO 39.95 Bl 254 Bi 6.55% 1232% 1.44 152.87 9.72 82.03 3.1 30.00% 72 TM $243.58 B1 $17.21 BA 6.29% 15.49% 1.09 $152.74 $10.8 $73.39 $2.39 23.00% 10.3 GM RNO TM S&P 500 -7.30 -2.4 92 16.00 7.70 -15.2 7.5 Growth Rates % Sales (Otr vs year ago atr) Net Income (Qtr vs year ago qt) Sales (5-Year Annual Avg.) Net Income (5-Year Annual Avg.) Dividends (5-Year Annual Avg.) -278.60 0.36 Industry (US) 8.80 605.70 6.77 8.72 19.28 2.1 13.47 NA 22.39 27.5 11.03 24.19 33.78 19.82 10.44 -12.94 GEN MOTORS 3 of 22-F-2000 100% -30% -60 -40% -20% 02 -20% 100.00 Sepos Jaroz Eepot Jane M. volume Millions 50.00 0.00 Copyright 2008 Yahoo! Inc. http://finance.com/ AGSPC represents S&P 500 RNO.PA represents Renault TM represents Toyota Motors Standard deviation Variance GM 0.2527 0.0639 RNO 0.1686 0.0284 TM 0.1534 0.0235 S&P500 0.0819 0.0067 Correlation coefficient GM RNO TM 1.0000 0.4877 0.7932 0.4877 1.0000 0.6769 0.7932 0.6769 1.0000 0.6342 0.8843 0.7967 Vol GM OPTIONS QUOTATION GM SHARE ON FEB 25: $24.20 CALL Expire at close Fri Sep 19, 2008 Strike Symbol Last 12.50 GMIS.X 14.50 0 17.50 GMITX 10.80 0 20.00 GMIDX 6.40 32 22.50 GMIX.X 4.58 200 25.00 GMIEX 3.25 220 27.50 GMIYX 2.28 235 30.00 GMIFX 1.60 40 32.50 GMIZX 1.05 27 35.00 GMIG.X 0.54 31 37.50 GMIU.X 0.40 6 40.00 GMIHX 0.19 15 42.50 GMIVX 0.12 64 RNO OPTIONS QUOTATION RNO ON FEB 25: 71.67 CALL Expire at close Fri, Sep 19.2008 Strike Symbol Last Vol 70.00 1627A.PA 0,00 0 75.00 3127B.PA 0,48 2.000 85.00 1436C PA 0,00 0 85,00 2781B.PA 0,20 1.000 86,00 1501A. PA 0,00 0 90.00 1898S.PA 0,00 0 95,00 1435C. PA 0,18 46.000 95,00 24668.PA 0,11 3.000 100,00 4040S.PA 0,13 6.000 105,00 1434C.PA 0,26 48.000 105,00 21808. PA 0,08 10.000 110,00 1666Z PA 0,00 0 110,00 3702252.PA 0,00 0 110,00 1413A. PA 0,05 1.000 110,00 18888.PA 0,15 0 110,00 3576286. PA 0,15 1.000 110,00 1993H.PA 0,00 0 115,00 26668.PA 0,15 34.000 130,00 11888. PA 0,32 0 130,00 3439291.PA 0,32 0 130,00 2990S.PA 0,10 150.000 PUT Expire at close FriSep 19, 2008 Strike Symbol Last Vol 10.00 GMUBX 12.50 GMUS.X 15.00 GMUC. X 17.50 GMUTX 20.00 GMUD.X 22.50 GMUXX 25,00 GMUEX 27.50 GMUY.X 30.00 GMUFX 32.50 GMUZ.X 35.00 GMUG.X 37.50 GMUUX 40.00 GMUHX 42.50 GMUV.X 0.45 536 0.66 148 1.01 786 1.71 31 2.24 59 3.20 2,376 4.35 143 6.00 133 7.70 1 PUT Expire at close Fri, Sep 19, 2008 Strike Symbol Last Vol 60.00 31298.PA 0,27 8.000 72,00 1899S, PA 0,00 0 75,00 1669Z PA 1,30 3.000 75.00 1437C.PA 1,31 4.000 80,00 24698. PA 0,80 1.000 82.00 48568.PA 1,06 6.000 5 9.43 11.50 14.40 64 1 14.20 0 16.90 0 Appendix for Problem #2 GENERAL MOTORS (GM) General Motors Corporation (GM) is primarily engaged in the worldwide development production and marketing of cars, trucks and parts. The Company develops, manufactures and markets its vehicles worldwide through its four automotive regions: GM North America, GM Europe, GM Latin America/Africa/Mid-East and GM Asia Pacific. GMGs finance and insurance operations are primarily conducted through GMAC LLC (GMAC). GMAC was a wholly owned subsidiary, until November 30, 2006, when GM sold a 51% controlling ownership interest in GMAC. As a result, the Company holds a 49% ownership interest in GMAC, which provides a range of financial services. GMGs total worldwide car and truck deliveries were 9.1 million during the year ended December 31, 2006. In January 2007, Isuzu Motors Limited acquired the 100% stake in a diesel engine development company, which is a joint venture between Isuzu Motors and General Motors Corporation RENAULT (RNO) Renault is an international automobile manufacturer that is based in France. The Company acts as a parent company for its subsidiaries that are located throughout the world. Renault has two main areas of business activity: the Automobile division, which handles the design, manufacture and marketing of vehicles, and the Sales Financing division, which is closely linked to the Company's sales activities. The Automobile division comprises the Renault, Samsung (South Korea) and Dacia (Romania) brands, and is engaged in the design, development and marketing of passenger cars and light-commercial vehicles. In 2006, this division's revenues represented 95.3% of Renault's total revenues. The Sales Financing division provides financial and commercial services, and is comprised of RCI Banque and its subsidiaries, a total of approximately 60 companies. In 2006, the Sales Financing division generated 4.6% of Renault's total revenues. TOYOTA (TM) TOYOTA MOTOR CORPORATION (TOYOTA) primarily conducts business in the automotive industry. Toyota also conducts business in the finance and other industries. Its business segments are automotive operations, financial services operations and all other operations, its automotive operations include the design manufacture, assembly and sale of passenger cars, minivans and trucks and related parts and accessories. Toyota's financial services business consists primarily of providing financing to dealers and their customers for the purchase or lease of Toyota vehicles. Its financial services also provide retail leasing through the purchase of lease contracts onginated by Toyota dealers. Related to Toyota's automotive operations is its development of intelligent transport systems. Toyota sells its vehicles in more than 170 countries and regions. Toyota os primary markets for its automobiles are Japan, North America, Europe and Asia. Financial Highlights Sales Income Net Profil Margin Return on Equity Debt/Equity Ratio Revenue/Share Earnings/Share Book ValueShare Dividend Rate Payout Ratio PE GM $181.12 B $43.30 B -23.97% NA NA $320.00 -568.43 $65.53 $1.00 NA NA RNO 39.95 Bl 254 Bi 6.55% 1232% 1.44 152.87 9.72 82.03 3.1 30.00% 72 TM $243.58 B1 $17.21 BA 6.29% 15.49% 1.09 $152.74 $10.8 $73.39 $2.39 23.00% 10.3 GM RNO TM S&P 500 -7.30 -2.4 92 16.00 7.70 -15.2 7.5 Growth Rates % Sales (Otr vs year ago atr) Net Income (Qtr vs year ago qt) Sales (5-Year Annual Avg.) Net Income (5-Year Annual Avg.) Dividends (5-Year Annual Avg.) -278.60 0.36 Industry (US) 8.80 605.70 6.77 8.72 19.28 2.1 13.47 NA 22.39 27.5 11.03 24.19 33.78 19.82 10.44 -12.94 GEN MOTORS 3 of 22-F-2000 100% -30% -60 -40% -20% 02 -20% 100.00 Sepos Jaroz Eepot Jane M. volume Millions 50.00 0.00 Copyright 2008 Yahoo! Inc. http://finance.com/ AGSPC represents S&P 500 RNO.PA represents Renault TM represents Toyota Motors Standard deviation Variance GM 0.2527 0.0639 RNO 0.1686 0.0284 TM 0.1534 0.0235 S&P500 0.0819 0.0067 Correlation coefficient GM RNO TM 1.0000 0.4877 0.7932 0.4877 1.0000 0.6769 0.7932 0.6769 1.0000 0.6342 0.8843 0.7967 Vol GM OPTIONS QUOTATION GM SHARE ON FEB 25: $24.20 CALL Expire at close Fri Sep 19, 2008 Strike Symbol Last 12.50 GMIS.X 14.50 0 17.50 GMITX 10.80 0 20.00 GMIDX 6.40 32 22.50 GMIX.X 4.58 200 25.00 GMIEX 3.25 220 27.50 GMIYX 2.28 235 30.00 GMIFX 1.60 40 32.50 GMIZX 1.05 27 35.00 GMIG.X 0.54 31 37.50 GMIU.X 0.40 6 40.00 GMIHX 0.19 15 42.50 GMIVX 0.12 64 RNO OPTIONS QUOTATION RNO ON FEB 25: 71.67 CALL Expire at close Fri, Sep 19.2008 Strike Symbol Last Vol 70.00 1627A.PA 0,00 0 75.00 3127B.PA 0,48 2.000 85.00 1436C PA 0,00 0 85,00 2781B.PA 0,20 1.000 86,00 1501A. PA 0,00 0 90.00 1898S.PA 0,00 0 95,00 1435C. PA 0,18 46.000 95,00 24668.PA 0,11 3.000 100,00 4040S.PA 0,13 6.000 105,00 1434C.PA 0,26 48.000 105,00 21808. PA 0,08 10.000 110,00 1666Z PA 0,00 0 110,00 3702252.PA 0,00 0 110,00 1413A. PA 0,05 1.000 110,00 18888.PA 0,15 0 110,00 3576286. PA 0,15 1.000 110,00 1993H.PA 0,00 0 115,00 26668.PA 0,15 34.000 130,00 11888. PA 0,32 0 130,00 3439291.PA 0,32 0 130,00 2990S.PA 0,10 150.000 PUT Expire at close FriSep 19, 2008 Strike Symbol Last Vol 10.00 GMUBX 12.50 GMUS.X 15.00 GMUC. X 17.50 GMUTX 20.00 GMUD.X 22.50 GMUXX 25,00 GMUEX 27.50 GMUY.X 30.00 GMUFX 32.50 GMUZ.X 35.00 GMUG.X 37.50 GMUUX 40.00 GMUHX 42.50 GMUV.X 0.45 536 0.66 148 1.01 786 1.71 31 2.24 59 3.20 2,376 4.35 143 6.00 133 7.70 1 PUT Expire at close Fri, Sep 19, 2008 Strike Symbol Last Vol 60.00 31298.PA 0,27 8.000 72,00 1899S, PA 0,00 0 75,00 1669Z PA 1,30 3.000 75.00 1437C.PA 1,31 4.000 80,00 24698. PA 0,80 1.000 82.00 48568.PA 1,06 6.000 5 9.43 11.50 14.40 64 1 14.20 0 16.90 0


