Question
Problem 23.1A Horizontal and vertical analysis of income statement and balance sheet. LO 23-1, 23-2 The EastTN Company sells computer parts through a retail store
Problem 23.1A Horizontal and vertical analysis of income statement and balance sheet. LO 23-1, 23-2
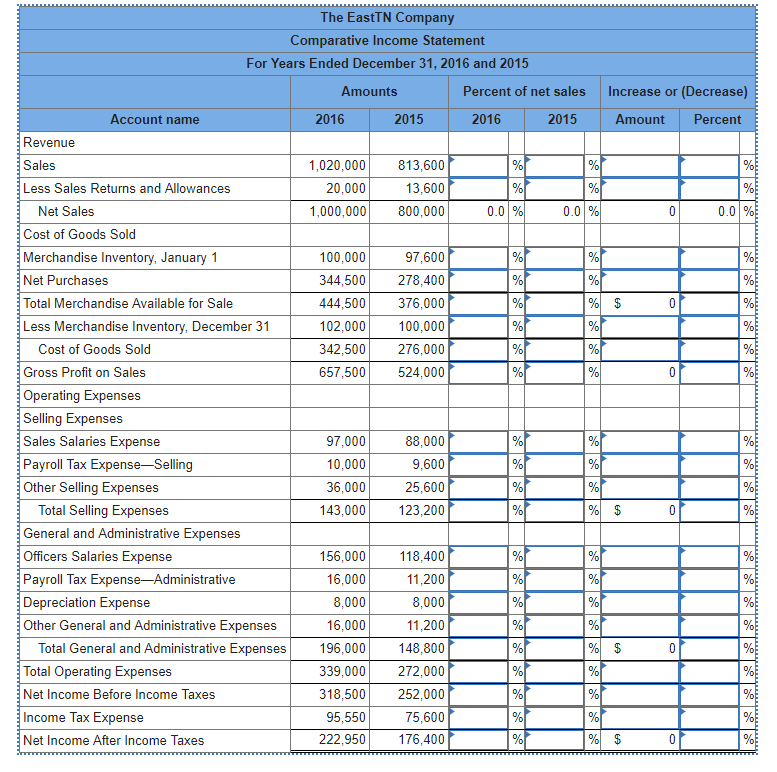
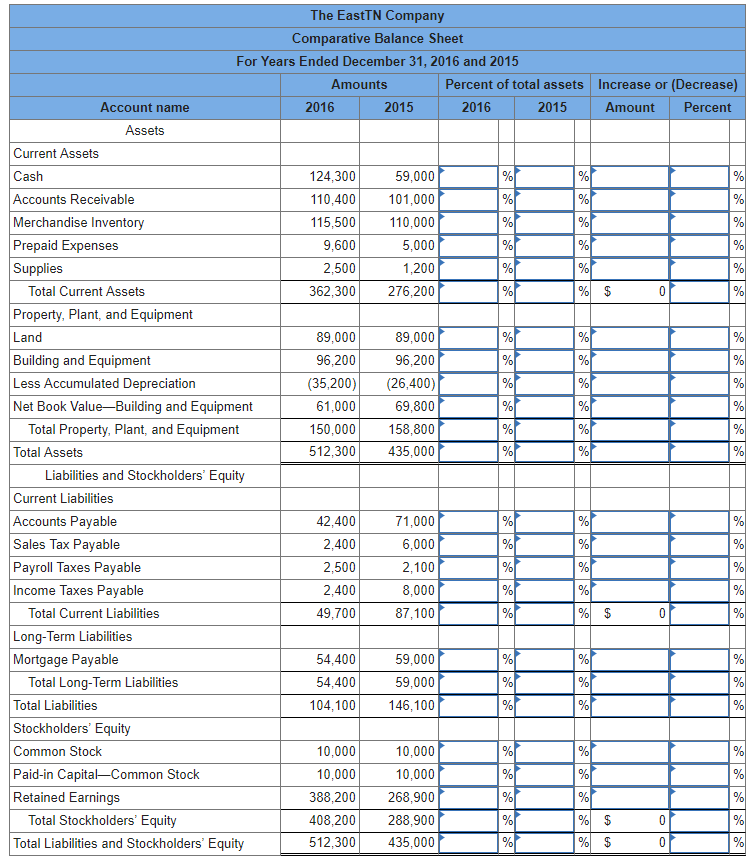
The EastTN Company sells computer parts through a retail store that it operates. The firms comparative income statement and balance sheet for the years 2016 and 2015 are shown below. |
1-a. | Complete both a horizontal and a vertical analysis of comparative income statement for the years 2016 and 2015. (Round your percentage answers to 1 decimal place. i.e., 0.123 should be entered as 12.3.) |
1-b. | Complete both a horizontal and a vertical analysis of comparative balance sheet for the years 2016 and 2015. (Round your percentage answers to 1 decimal place. i.e., 0.123 should be entered as 12.3. Negative amounts should be indicated by a minus sign.)
|
The EastTN Company Comparative Income Statement For Years Ended December 31, 2016 and 2015 Amounts Percent of net sales Increase or (Decrease) Account name 2016 2015 2016 2015 Amount Percent Revenue Sales Less Sales Returns and Allowances 1,020,000 20,000 813,600 13,600 1,000,000 800,000 Net Sales Cost of Goods Sold Merchandise Inventory, January 1 Net Purchases Total Merchandise Available for Sale Less Merchandise Inventory, December 31 0.0 0.0 0.01% 100,000 344,500 44,500376,000 102,000 342,500 657,500 97,600 278,400 100,000 276,000 524,000 Cost of Goods Sold Gross Profit on Sales Operating Expenses Seing Expenses Sales Salaries Expense Payroll Tax Expense-Selling Other Selling Expenses 97,000 10,000 36,000 43,000 123,200 88,000 9,600 25,600 Total Selling Expenses General and Administrative Expenses Officers Salaries Expense Payroll Tax Expense-Administrative Depreciation Expense Other General and Administrative Expenses 118,400 11,200 8,000 11,200 Total General and Administrative Expenses 196,000 148,800 339,000272,000 318,500252,000 75,600 176,400 156,000 16,000 8,000 16,000 Total Operating Expenses Net Income Before Income Taxes Income Tax Expense Net Income After Income Taxes 95,550 222,950 The EastTN Company Comparative Balance Sheet For Years Ended December 31, 2016 and 2015 Amounts Percent of total assets Increase or (Decrease) Amount Percent Account name 2016 2015 2016 2015 Assets Current Assets Cash Accounts Receivable Merchandise Inventory Prepaid Expenses Supplies 59,000 101,000 110,000 5,000 1,200 362,300276,200 124,300 110,400 115,500 9,600 2,500 Total Current Assets Property, Plant, and Equipment Land Building and Equipment Less Accumulated Depreciation Net Book Value-Building and Equipment 89,000 96,200 (35,200) (26,400) 69,800 158,800 512,300435,000 89,000 96,200 61,000 Total Property, Plant, and Equipment Total Assets 150,000 Liabilities and Stockholders' Equity Current Liabilities Accounts Payable Sales Tax Payable Pavroll Taxes Pavable Income Taxes Pavable 42,400 2,400 2,500 2,400 49,700 71,000 6,000 2,100 8,000 87,100 Total Current Liabilities Long-Term Liabilities Mortgage Payable 54,400 54,400 104,100 59,000 59,000 146,100 Total Long-Tem Liabilities otal Liabilities Stockholders Equity Common Stock Paid-in Capital-Common Stock Retained Earnings 10,000 10,000 388,200 268,900 408,200 288,900 435,000 10,000 10,000 Total Stockholders' Equity Total Liabilities and Stockholders' Equity 512,300
Step by Step Solution
There are 3 Steps involved in it
Step: 1
Get Instant Access to Expert-Tailored Solutions
See step-by-step solutions with expert insights and AI powered tools for academic success
Step: 2
Step: 3
Ace Your Homework with AI
Get the answers you need in no time with our AI-driven, step-by-step assistance
Get Started