

Answered step by step
Verified Expert Solution
Question
1 Approved Answer
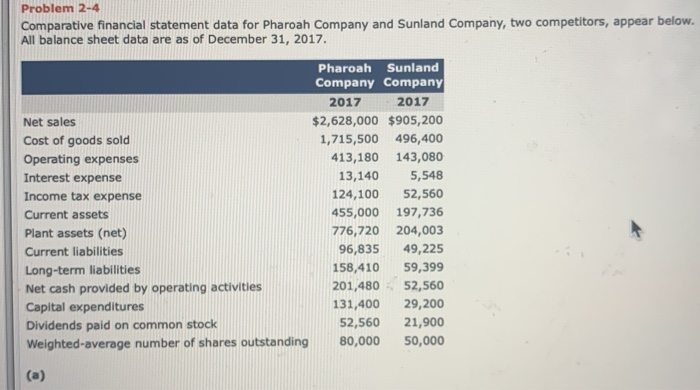
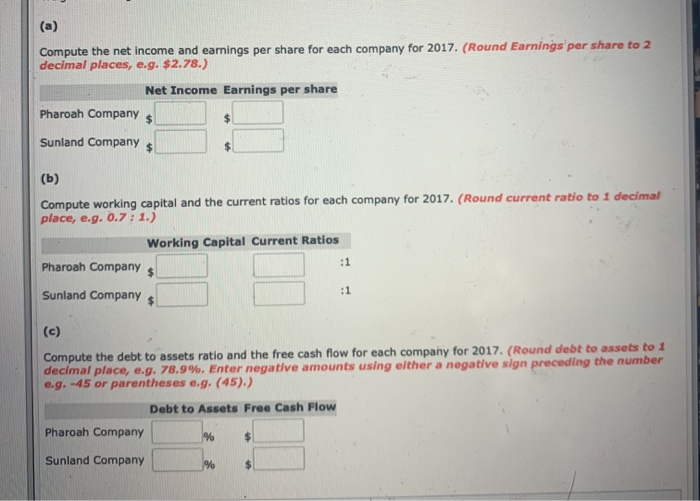
Problem 2-4 Comparative financial statement data for Pharoah Company and Sunland Company, two competitors, appear below. All balance sheet data are as of December 31,
Step by Step Solution
There are 3 Steps involved in it
Step: 1

Get Instant Access to Expert-Tailored Solutions
See step-by-step solutions with expert insights and AI powered tools for academic success
Step: 2

Step: 3
Ace Your Homework with AI
Get the answers you need in no time with our AI-driven, step-by-step assistance
Get Started
Audit Committee Essentials
Authors: Curtis C. Verschoor
1st Edition
0471699594, 978-0471699590