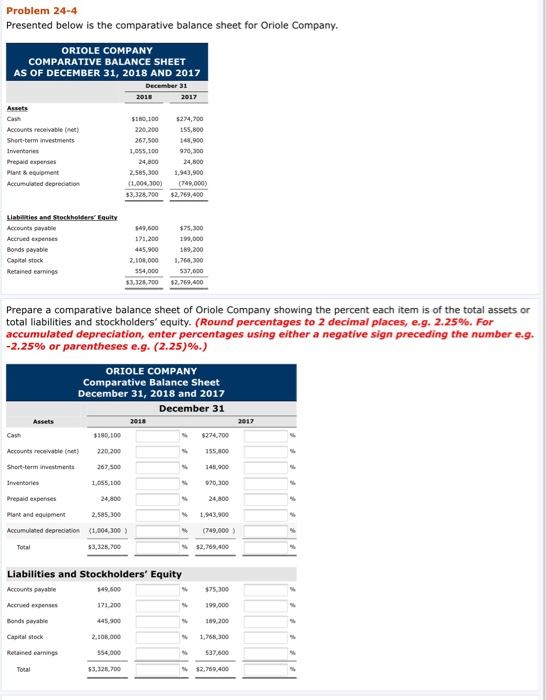
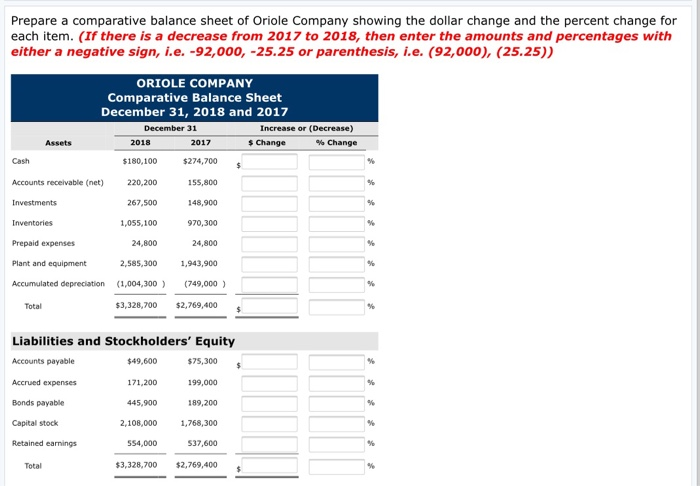
Problem 24-4 Presented below is the comparative balance sheet for Oriole Company. ORIOLE COMPANY COMPARATIVE BALANCE SHEET AS OF DECEMBER 31, 2018 AND 2017 December 31 2018 2017 Assets Cash $180,100 $274,700 Accounts receivable (net)a 220,200 155,800 Short-term investments 267,500 148,900 Inventaries 1,055,100 970,300 Prepaid experses 24,800 24,800 1,943,900 Plant& equipment 2.585.300 Accumulated depreciations (1,004,300) (749,000) $3,328,700 $2,769,400 Liabilities and Stockholders Equity Accounts payabler $49,600 $75,300 Accrued expenses 171.200 199,000 Bonds payable 445,900 189.200 Capital stock 2.108,000 1,768,300 537,600 Retained eamings s54,000 $3128,700 $2,769,400 Prepare a comparative balance sheet of Oriole Company showing the percent each item is of the total assets or total liabilities and stockholders' equity. (Round percentages to 2 decimal places, e.g. 2.25 % . For accumulated depreciation, enter percentages using either a negative sign preceding the number e.g. -2.25 % or parentheses e.g. (2.25)%. ) ORIOLE COMPANY Comparative Balance Sheet December 31, 2018 and 2017 December 31 Assets 2018 2017 Cash $180,100 s274,700 Accounts receivable (net)s 220,200 155800 Short-berm investments 267,500 148,900 Inventories 1,055,100 970.300 Prepaid experses 24,800 24,800 Plant and equipment 2,585,300 1.943.900 Accumulated depreciation- (1.004.300) (749,000) $3,328,700 $2.769.400 Total Liabilities and Stockholders' Equity Accounts payable $49,6004 $75.300 Accrued expenses 199,000 171.200 Bonds payable 445,900 189,2004 2.108.000 Capital stock 1.768.300 Retained eanings 554.000 537,600 ral $3.328.700 $2,769,400 Prepare a comparative balance sheet of Oriole Company showing the dollar change and the percent change for each item. (If there is a decrease from 2017 to 2018, then enter the amounts and percentages with either a negative sign, i.e. -92,00o, -25.25 or paren thesis, i.e. (92,000), (25.25)) ORIOLE COMPANY Comparative Balance Sheet December 31, 2018 and 2017 December 31 Increase or (Decrease) s Change % Change Assets 2018 2017 $274,700 Cash $180,100 % Accounts receivable (net) 220,200 155,800 Investments 267,500 148,900 Inventories 1,055,100 970,300 Prepaid expenses 24,800 24,800 Plant and equipment 2,585,300 1,943,900 Accumulated depreciation (1,004,300) (749,000) $3,328,700 $2,769,400 Total Liabilities and Stockholders' Equity Accounts payable $49,600 $75,300 Accrued expenses 199,000 % 171,200 445.900 Bonds payable 189,200 Capital stock 2,108,000 1,768,300 Retained earnings s54,000 S37,600 $3,328,700 $2,769,400 Total


