Answered step by step
Verified Expert Solution
Link Copied!

Question

1 Approved Answer

Problem 3 (5 Points): Create a MATLAB Script File to generate a three-dimensional line plot of the following system of equations over the parametric range
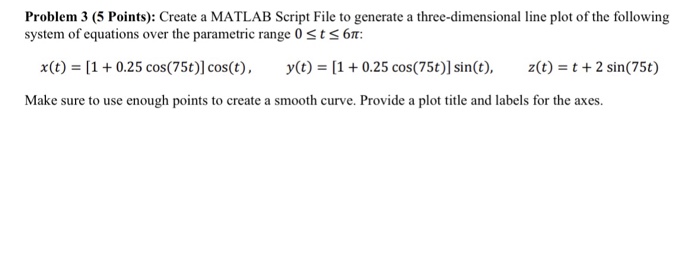
image text in transcribed
Problem 3 (5 Points): Create a MATLAB Script File to generate a three-dimensional line plot of the following system of equations over the parametric range 0 t 6T. x(t) = [1 + 0.25 cos(75t)] cos(t), y(t) = [1 + 0.25 cos(75t)] sin(t), z(t) = t + 2 sin(75t) Make sure to use enough points to create a smooth curve. Provide a plot title and labels for the axes

Step by Step Solution

There are 3 Steps involved in it

Step: 1

blur-text-image

Get Instant Access to Expert-Tailored Solutions

See step-by-step solutions with expert insights and AI powered tools for academic success

Step: 2

blur-text-image

Step: 3

blur-text-image

Ace Your Homework with AI

Get the answers you need in no time with our AI-driven, step-by-step assistance

Get Started

Recommended Textbook for

Linked Data A Geographic Perspective

Authors: Glen Hart, Catherine Dolbear

1st Edition

1000218910, 9781000218916

More Books

Students also viewed these Databases questions

Question

What were the reasons for your conversion or resistance?

Answered: 1 week ago