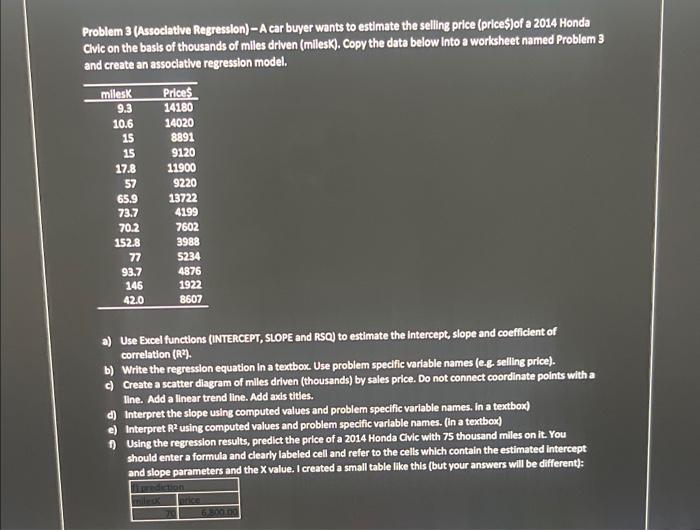
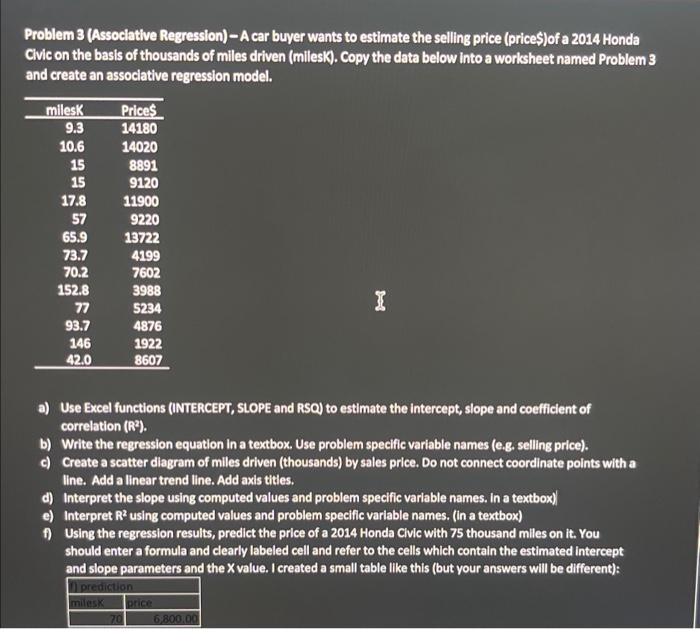
Problem 3 (Associative Regression) - A car buyer wants to estimate the selling price (priceS)of a 2014 Honda Clvic on the basis of thousands of miles drlven (milesK). Copy the data below Into a worksheet named Problem 3 and create an assoclative regression model. a) Use Excel functions (INTERCEPT, SLOPE and RSO) to estimate the intercept, slope and coefficlent of correlation (R2) b) Write the regression equation in a textbox. Use problem specific variable names (e.g selling price). c) Create a scatter diagram of miles driven (thousands) by sales price. Do not connect coordinate points with a line. Add a linear trend line. Add axis tities. d) Interpret the slope using computed values and problem specific variable names, In a textbox) e) Interpret R2 using computed values and problem specific varlable names. (in a textbox) f) Using the regression results, predict the price of a 2014HondaCvicwith75 thousand miles on it. You should enter a formula and clearly labeled cell and refer to the cells which contain the estimated intercept and slope parmeters and the X value. I created a small table like this (but your answers will be different): \begin{tabular}{|l|l|} \hline \multicolumn{2}{|l|}{ f) prediction } \\ \hline milesK & price \\ \hline 70 & 6,800.00 \\ \hline \end{tabular} Problem 3 (Associative Regression) - A car buyer wants to estimate the selling price (priceS) of a 2014 Honda Civic on the basis of thousands of miles driven (milesK). Copy the data below into a worksheet named Problem 3 and create an associative regression model. a) Use Excel functions (INTERCEPT, SLOPE and RSO) to estimate the intercept, slope and coefficient of correlation (R2). b) Write the regression equation in a textbox. Use problem specific variable names (e.g. selling price). c) Create a scatter diagram of miles driven (thousands) by sales price. Do not connect coordinate points with a line. Add a linear trend line. Add axis tities. d) Interpret the slope using computed values and problem specific varlable names. In a textbox)| e) Interpret R2 using computed values and problem specific variable names. (in a textbox) f) Using the regression results, predict the price of a 2014 Honda Clivic with 75 thousand miles on it. You should enter a formula and clearly labeled cell and refer to the cells which contain the estimated intercept and slope parameters and the X value. I created a small table like this (but your answers will be different)


