

Answered step by step
Verified Expert Solution
Question
1 Approved Answer
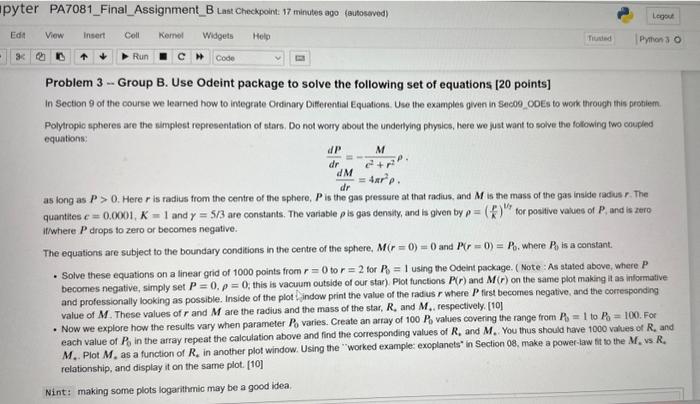
Problem 3 - Group B. Use Odeint package to solve the following set of equations [20 points] In Section 9 of the course we learned
Step by Step Solution
There are 3 Steps involved in it
Step: 1

Get Instant Access to Expert-Tailored Solutions
See step-by-step solutions with expert insights and AI powered tools for academic success
Step: 2

Step: 3
Ace Your Homework with AI
Get the answers you need in no time with our AI-driven, step-by-step assistance
Get Started
Modern Database Management
Authors: Jeff Hoffer, Ramesh Venkataraman, Heikki Topi
12th edition
133544613, 978-0133544619